
What Is A Digital Transformation Strategy?
A digital transformation strategy refers to the optimization of technology and technological services as a means of facilitating business transformation. This can be done by modifying business processes, for instance, with the automation of manual processes, or creating new processes with new technology. It entails harnessing the power of digital technologies to redefine business models, streamline workflows, enhance efficiency, and deliver better value to customers.
At its core, a digital transformation strategy involves embracing and integrating digital technologies across different areas of an organization, including but not limited to communication, data management, marketing, operations, and customer engagement. It goes beyond simply implementing isolated digital solutions and instead aims to create a holistic and interconnected digital ecosystem that supports the organization's overall business goals and objectives.
📚 Recommended read: Digital Transformation Strategy: Process, Challenges & Examples
What Is A Digital Transformation Strategy Template?
A digital transformation plan template is a predefined framework or structure that organizations can use as a guide to develop their own digital transformation roadmap. It provides a systematic approach to creating a digital strategy by outlining key components and steps required for successful digital transformation.
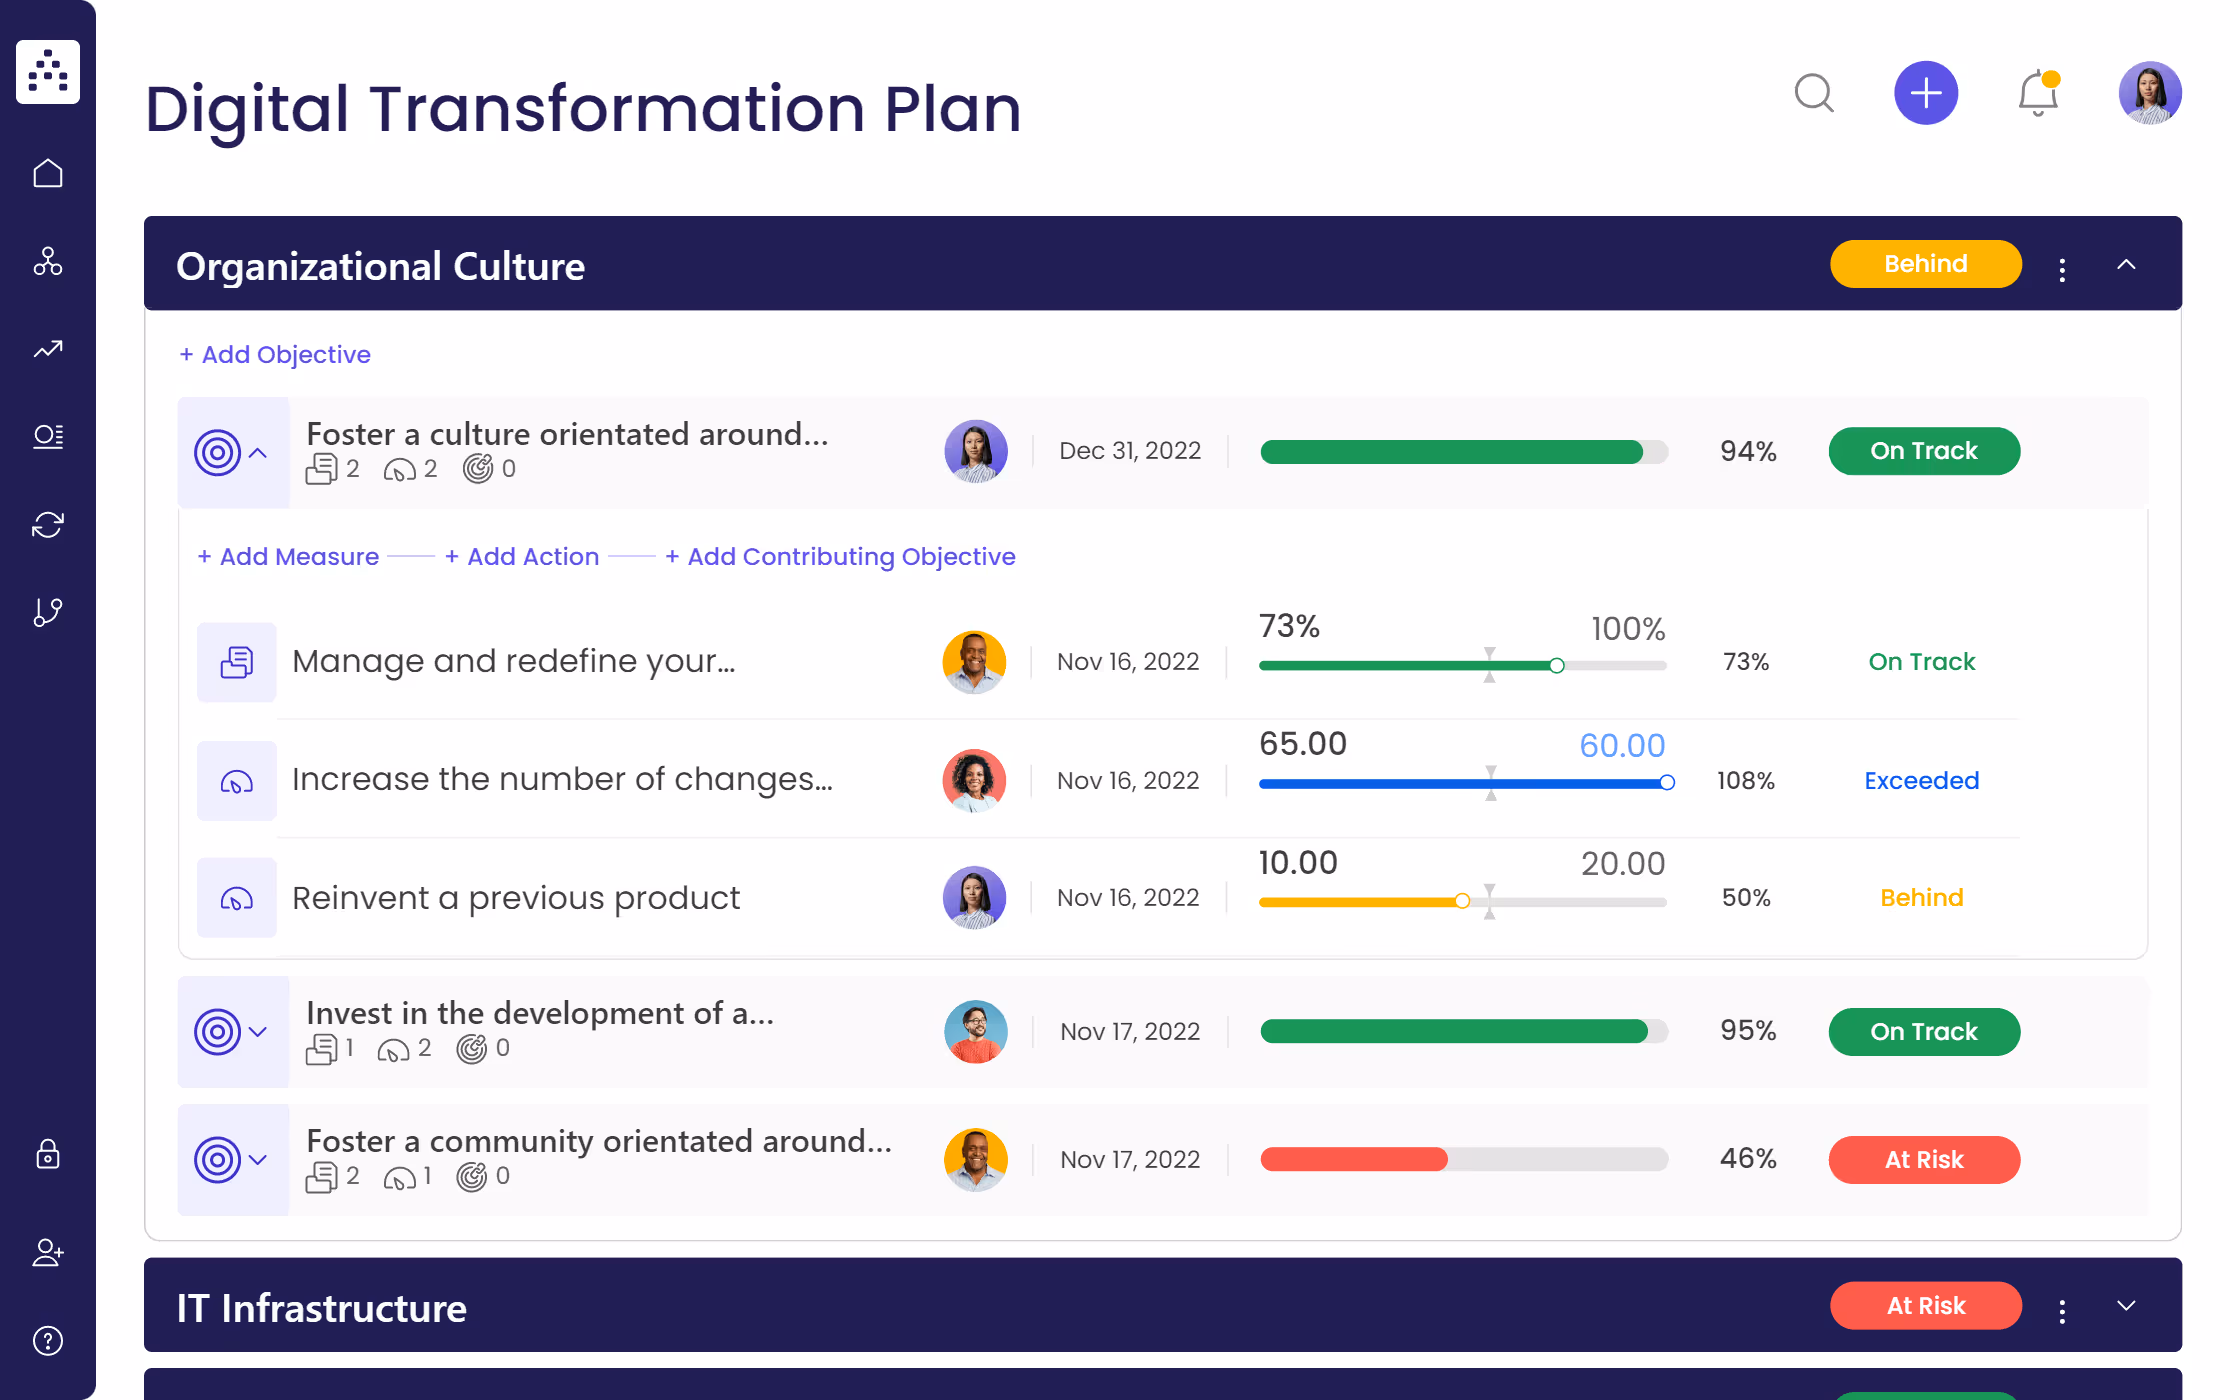
The template typically includes various sections and elements that assist in the planning and execution of the digital transformation journey. One crucial aspect is the roadmap, which outlines the timeline and milestones for implementing different digital initiatives. It serves as a visual representation of the organization's digital transformation journey, helping stakeholders understand the overall plan and the sequence of activities.
What's Included In This Digital Transformation Strategy Template?
Check out this quick video to see your template live and learn how to make the most out of it:
Here's what you'll find:
- 4x Digital Transformation Focus Areas
- 12x Digital Transformation Objectives
- 19x Digital Transformation Projects
- 27x Digital Transformation KPIs
Once you have set your template, you can also create dashboards for real-time performance monitoring.
And yes - you get free access with no credit card required. ✅
Who Is This Digital Transformation Strategy Template For?
The digital transformation strategy template is primarily designed for organizations of all sizes and across various industries that are embarking on a digital transformation journey. While it is applicable to both established companies and startups, the template particularly addresses the needs and considerations of organizations undergoing significant business transformation.
Chief Information Officers (CIOs) are responsible for the majority of a Digital Transformation plan. CIOs can facilitate directing an organization toward digital transformation and instill more plans and procedures to help this transition go more smoothly. CEOs would also be extremely crucial in communicating this new direction and ensuring there is sufficient information provided to all stakeholders (internal and external) to ensure everyone is able to adapt and progress.
How Is This Digital Transformation Strategy Template Relevant To Your Organization?
You can use this Digital Transformation to enhance the value of some of your core business functions, from sales and HR to finance and operations. Using this template can help you efficiently use your time by automating key areas and, thus, invest more time in greater business opportunities.
These are some of the benefits of using our Digital Transformation Strategy Template:
- Structured approach: The template provides a systematic approach, ensuring that your organization follows a clear roadmap. It helps you define business goals, identify key initiatives, and establish a step-by-step plan for your digital transformation process.
- Tailored to your needs: It can be customized to fit the unique requirements of your organization. Whether you are a startup or an established business, the template can be adapted to align with your specific industry, size, and goals.
- Strategic decision-making: With the template, your organization can make data-driven and strategic decisions regarding technology investments and initiatives. It helps you evaluate your current state, assess opportunities for improvement, and prioritize digital projects that will have the most impact.
- Maximizing efficiency: Digital transformation is all about enhancing efficiency. The template guides you in identifying areas for automation, streamlining processes, and leveraging digital tools to improve operational efficiency. It enables your organization to respond quickly to market changes, customer needs, and emerging trends.
- Leadership alignment: Our template facilitates alignment among key stakeholders, including CIOs, CEOs, and other leaders within your organization. It provides a common language and framework for discussing and executing digital transformation efforts.
How To Use The Digital Transformation Strategy Template
Creating a Digital Transformation Plan from scratch can feel overwhelming. But don't worry, our Digital Transformation Strategy Template is here to make the planning process a breeze, so you can jump right into the exciting part: getting things done!
Just grab the template and follow these simple steps:
1. Define clear examples of your focus areas
The focus areas of your Digital Transformation Strategy can be as broad or narrow as you want, depending on the overall mission you are trying to achieve. The Digital Transformation Strategy Template we devised focuses on areas via the core business functions.
Examples of these focus areas are:
- Customer Experience: Enhancing satisfaction throughout the customer journey, delivering personalized interactions, and leveraging digital technologies to understand customer needs.
- Operational Processes: Streamlining workflows, automating tasks, and adopting the right technologies to improve efficiency, reduce errors, and enhance productivity.
- IT Infrastructure: Modernizing technology, embracing cloud computing, big data and artificial intelligence, and implementing secure systems for a solid foundation that supports seamless integration of digital solutions.
- Organizational Culture: Cultivating a culture of innovation, agility, and continuous learning by promoting adaptability, collaboration, and providing resources to embrace digital practices.
💡Pro Tip: Always include a focus area related to cultural change. Why? Because digital transformation has a significant impact on organizational culture. To navigate this change, effective change management and cultural transformation are essential. As organizations embrace digital technologies, they must also cultivate a culture that embraces innovation, agility, and continuous learning. This involves breaking down silos, promoting collaboration, and encouraging employees to explore new ideas and take calculated risks.
2. Think about the objectives that could fall under that focus area
Objectives can assist you and your team with more clarity about the things you have set out to achieve. A lot of the objectives you set should be specific and applicable to the broader focus area you’re trying to achieve. Setting clearly defined and measurable objectives help improve time management and organizational efficiency.
Examples of objectives that fall under the focus area of IT Infrastructure could be:
- Support changes to business models and product offerings, systems, and processes
- Improve the level of efficiency by providing solutions to customers
- Analyze efficiency and IT activity metrics that deliver value
3. Set yourself measurable targets (KPIs) to tackle the objective
Setting measurable targets, also known as Key Performance Indicators (KPIs), is crucial to address your objectives effectively. KPIs serve as important metrics that can be designed and established to drive business success. They provide measurable indicators and performance benchmarks, allowing you to track progress toward your overall business strategy.
Here are examples of KPIs for this strategic plan related to the focus area of IT Infrastructure:
- Increase innovation rate by 20%
- Improve the level of adoption of new products by 15%
- Increase automation of manual processes in the supply chain by 10%
Ensure that these KPIs have a defined time frame and are quantifiable, allowing you to track progress accurately.
💡Pro Tip: Regularly monitoring and analyzing these KPIs will provide insights into the effectiveness of your strategic plan and enable you to make informed decisions to drive success.
4. Implement related projects to achieve the Product Management KPIs
In a similar way to objectives providing clarity on the goals you are trying to achieve, projects provide clarity on how to achieve these. Projects provide you with tangible actions you can set for your team and yourself to achieve your said objectives.
Examples of projects that fall under the focus area of Customer Experience can be:
- Optimize smartphone app functionality to enhance user experience
- Personalize digital marketing campaigns for targeted customer segments
- Implement social media listening and sentiment analysis for brand insights
5. Utilize Cascade tools to track and visualize performance
Cascade is the world’s #1 strategy execution platform, remediating the chaos of running a business to help you move forward.
Launch your transformation strategy confidently and achieve faster results with Cascade's comprehensive features:
Streamline strategy reporting and gain valuable insights with Cascade reports. Easily generate concise real-time snapshot reports with complete control over columns, filters, sorting, and other customization options. This feature is ideal for presenting large amounts of data in a user-friendly and easily digestible format.
Cascade dashboards quickly and easily provide a visual aid of the KPIs you are trying to achieve. You can create multiple Dashboards and add numerous widgets to display both the projects and the KPIs you want to track in real-time.
.avif)
Consolidate your business systems underneath a unified roof to reach clarity in your strategic decision-making with Cascade’s integrations. These integrations span across a range of tools, including communication platforms like MS Teams and project management tools like Jira.
A Digital Transformation Case Study: Amazon
Amazon's Digital Transformation Strategy revolves around leveraging digital technologies to enhance its marketing techniques, improve customer experiences, and optimize its logistics system. Here are the key points:
- Marketing Strategy: Amazon's success lies in its aggressive marketing approach. It focuses on product assortment, competitive pricing, strategic placement, and effective promotions. The company also utilizes SEO optimization, pay-per-click advertising, and user-generated content to drive customer engagement.
- Personalized Recommendations: Amazon utilizes customer data and past shopping patterns to provide personalized product recommendations. This strategy helps retain loyal customers by anticipating their needs and enhancing their shopping experience.
- Shorter Delivery Times: Amazon's digital transformation involves deploying innovative technologies in its supply chain for faster deliveries. It plans to introduce drone delivery services for packages under 5 pounds, autonomous delivery with electric vehicles, and robotic arms for sorting and inventory management.
- Strategic Partnerships: Amazon invests in start-ups to tap into emerging technologies that can improve its logistics and supply chain management. By collaborating with innovative companies, Amazon aims to enhance its capabilities and make online shopping more convenient.
📚 Want to know more? Check out our Strategy Study: How Amazon Conquered the E-Commerce and Tech Industries Worldwide
Related Templates
🔍 Didn’t find what you were looking for? Check out our Template Library with thousands of templates to help you streamline your strategic planning process.