
What is a KPI reporting strategy?
A KPI reporting strategy is specifically designed to help you get started in writing out your KPIs in a documentation format to summarize how you are progressing to a certain goal.
What's included in this KPI reporting strategy template?
- KPI reporting Vision Statement
- 4x KPI reporting Values
- 4x KPI reporting Focus Areas
- 8x KPI reporting Objectives
- 10x KPI reporting Projects
- 10x KPI reporting KPIs
Who is this KPI reporting strategy template for?
A KPI reporting strategy template can be used from top to bottom of any organization. Managers can use such a template to educate their teams about the importance of setting targets, whilst employees can use it as a baseline framework to guide them in achieving targets.
Few more examples of professions and individuals who would find such a template useful: Strategy Analysts, Strategy Directors, CEOs, Line Managers, and, Consultants.
How is this KPI reporting strategy template relevant to your organization?
Such a template is vital in developing measurable and achievable targets that individuals and teams can work towards.
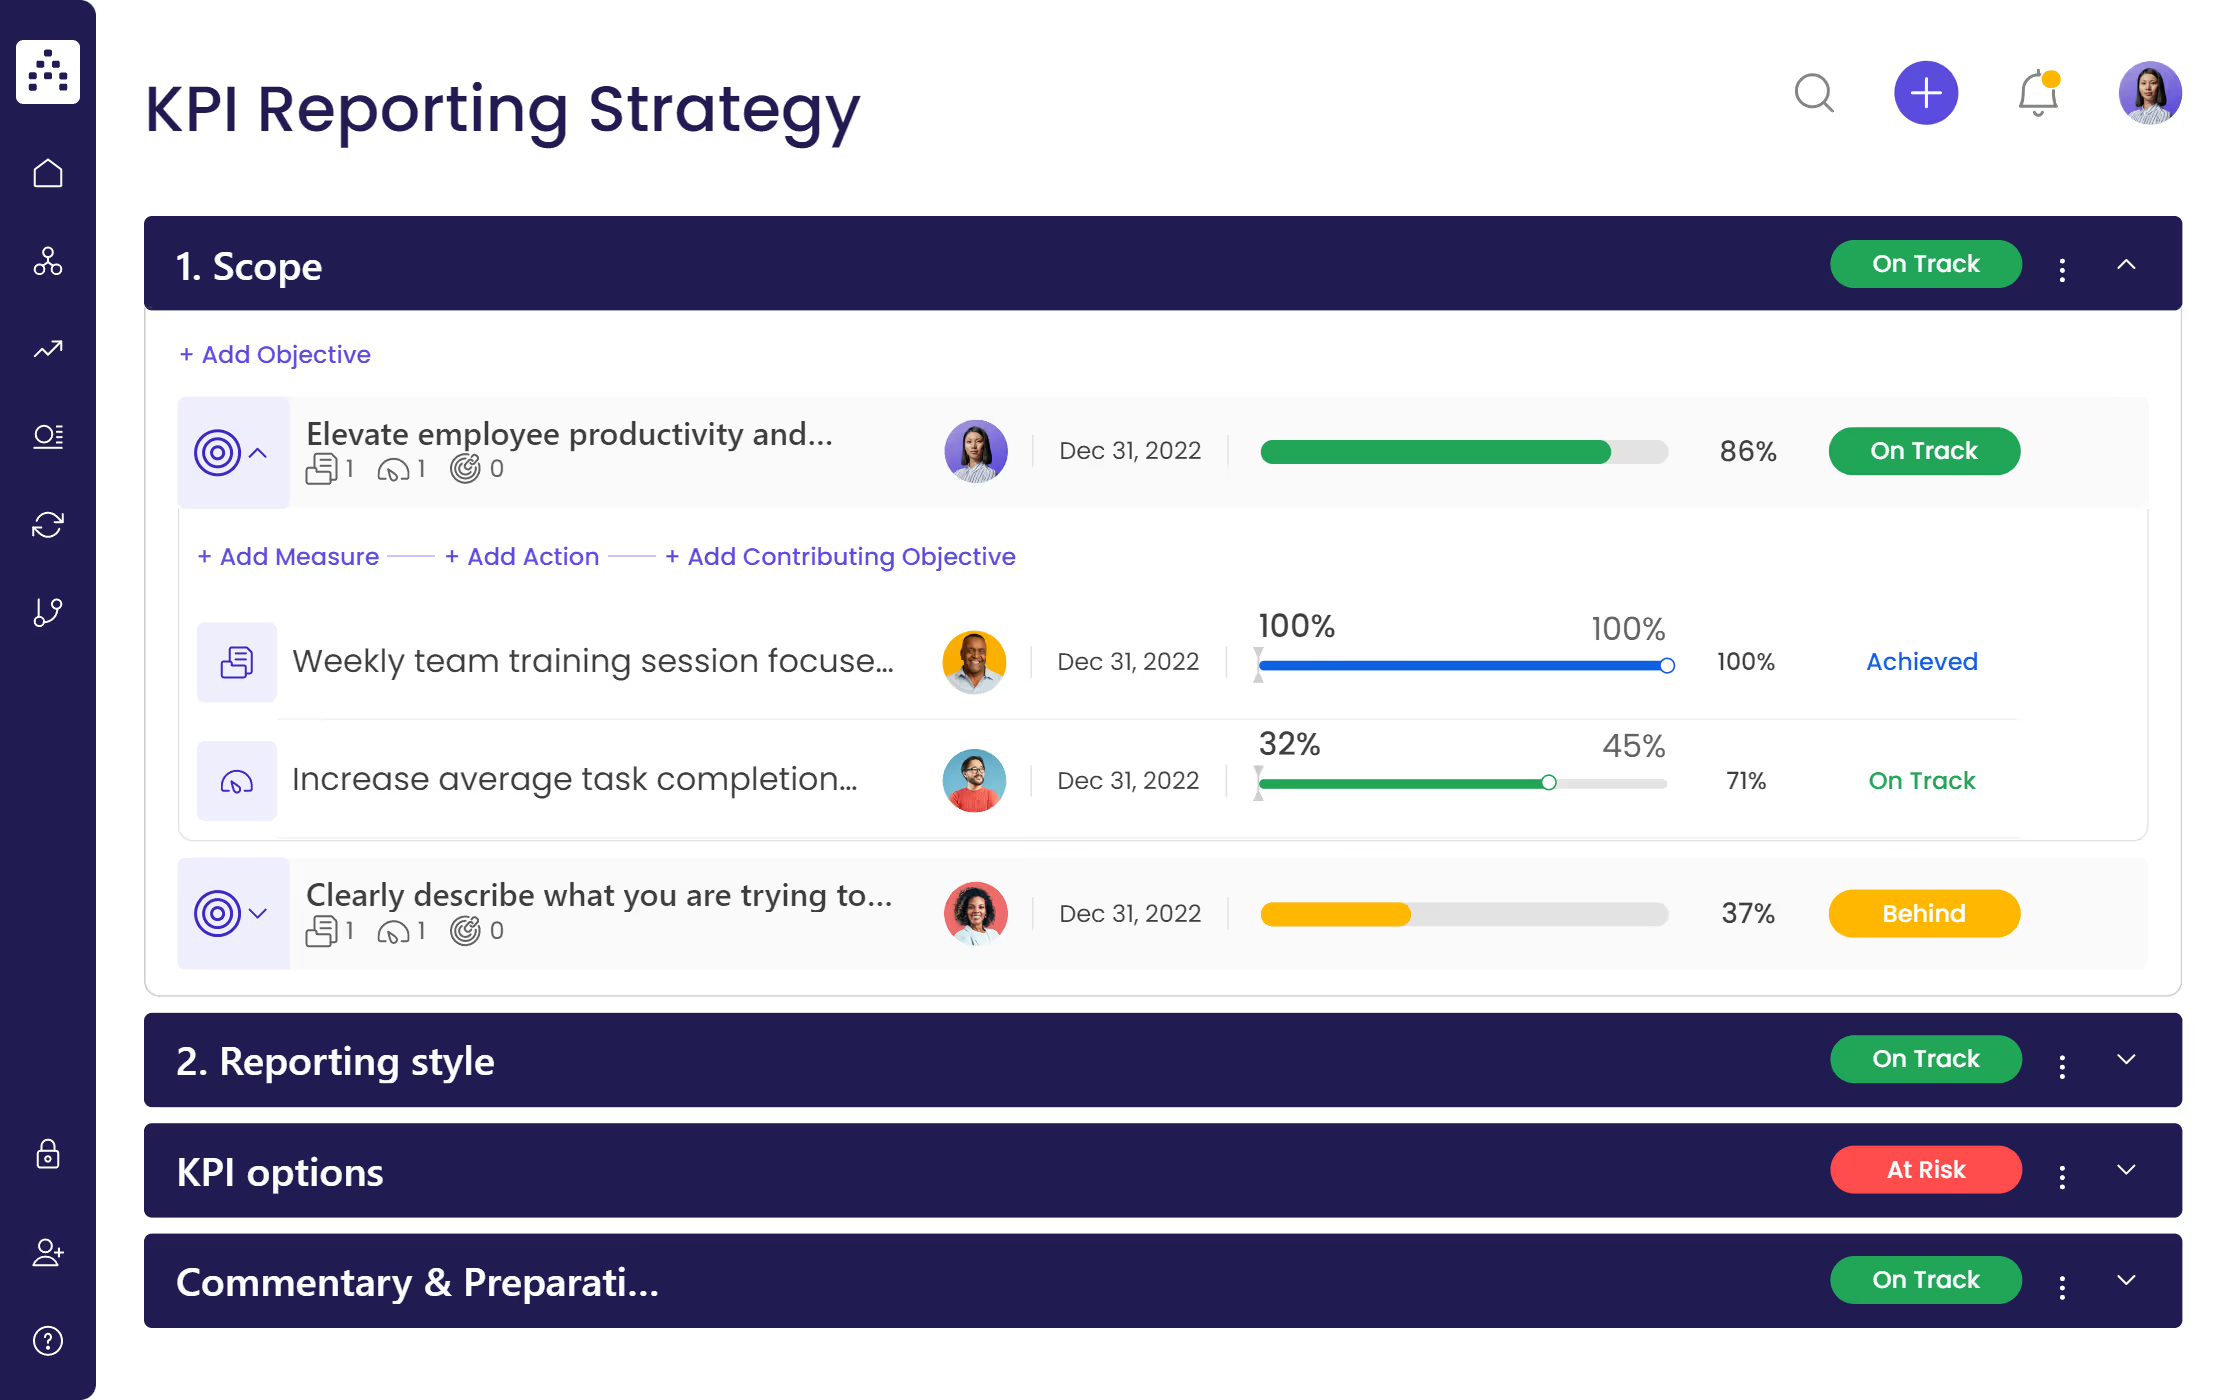
1. Decide on the Scope of Your KPI Report
In order to properly use this template and understand how it works, the Cascade team has broken down the focus areas into steps that need to be taken to write your KPI reporting strategy.
This step focuses on being specific on what you are trying to present and to whom you are trying to present your information.
An example of your scope for your KPI report could be: I'm trying to show my investors how our revenue metrics are progressing for the purpose of securing additional investment.
2.Select Your KPI Reporting Style
Cascade's SaaS platform has integrated two visual ways of presenting your information to make it easier and more aesthetic to decipher. The first option is in the form of a dashboard to assist in creating tables and goals that can easily be viewed in a graphical way. This makes it easy to see who is responsible for what goal as well as compare and track performance on the KPIs and Projects created in your KPI reporting strategic plan.
The other way is through a snapshot/ table that is slightly more data-centric but still visual enough to clearly assign different KPIs to your team and show specific values as to the progress made on the set KPIs.
3.Select the KPIs to Include in Your KPI Report
Selecting what KPIs to include will be based on the type of report you are creating. KPIs are key performance indicators used to evaluate the success of an organization. If you are struggling to come up with your own KPIs have a look at our top 84 KPIs. The KPIs directly link to achieving the scope of the report in addressing what you are specifically trying to achieve from the target goals.
KPIs vary from industry to industry so making sure they are relevant to the scope means ensuring they tie into what your organization is wanting to achieve within its sector. Two examples of finance KPIs are: Increase gross profit margin, improve overall operating cash flow (OCF).
4.Add Commentary & Be Prepared
One of the last steps in completing your KPI report is to actually implement the changes observed. What this means is using the data gathered from your KPIs you can work on changing your business focus area or reframing an area that might have needed improvement.
Still, need guidance? The Cascade Team has put together an article focusing on How to create a KPI report which goes through each of these steps in a lot more detail. Using our KPI reporting template can further your understanding of simplifying strategy and creating an easy plan for strategic reporting.
Here is a list of resources that you might want to check out to help you out: