

Health And Safety KPIs Overview
Health and safety key performance indicators (KPIs) are measurable values that health and safety teams use to monitor and evaluate their progress toward strategic business objectives. These KPIs essentially act as a starting point for an effective health and safety performance review.
While some organizations may not have considered implementing KPIs for health and safety, it’s important to recognize their relevance, even in low-risk sectors such as IT or marketing.

KPIs for health and safety are not solely focused on tracking workplace accidents; the "health metrics" component is equally vital and applicable across various industries, whether in manufacturing or marketing.
We’ve identified 18 KPIs that we consider to be the most effective for health and safety. However, other KPIs exist, and each organization may have unique needs.
For this reason, we’ve created a guide on how to write KPIs using a four-step approach, enabling you to customize your KPIs according to your organization's requirements.
✨BONUS: Grab our new free health and safety strategy template, which can help you develop and visualize your KPIs in the context of your overall strategy.
Health And Safety KPI Examples
The most common safety KPIs for safety management
Fatalities
This KPI measures the number of fatalities that occur as a result of work-related incidents. Fatalities are the most severe outcome of safety incidents and reducing the number of fatalities should be a key objective for any organization.
By tracking this KPI, organizations can identify areas where they may need to improve their safety policies and procedures, such as hazard identification, risk assessment, and incident investigation.
Total Recordable Incident Rate (TRIR)
This “lagging metric” gives a high-level benchmark to the organization in terms of knowing if its safety standards are improving or worsening.
TRIR is a KPI that measures the total number of incidents, injuries, or illnesses that occur in a workplace over a given period, usually expressed as a rate per 100 employees. It’s important because it provides an overall picture of safety performance and allows organizations to identify trends and areas of improvement. A high TRIR can indicate a need for better safety policies, preventive measures, and training.
Keep an extra close eye on this health and safety KPI during times of change—new processes, new machines, etc.
Lost Time Injury Frequency Rate (LTIFR)
LTIFR refers to the number of lost time injuries that happen per million hours worked. So an LTIFR of 8, would mean that 8 lost time injuries take place every million hours worked.
To work out the LTIFR you multiply the number of lost time injuries by 1,000,000 then divide that number by the total number of hours worked in an organization. So, if you have 8 lost time injuries and 3 million hours worked, your LTIFR is 2.6.
Lost Time Injury Incidence Rate (LTIIR)
This measures the events that occur over a standard period of time by a standard number of people. So, if we want to calculate the 'LTIIR' (Lost Time Injury Incidence Rate) for 1,000 people, we multiply the number of incidents by 100, then divide it by the number of people.
So let’s say we have 3 incidents. 3 x 100 = 300. Divide that by the number of people and we get a LTIIR of 0.3. So, for every 100 people, an organization would have a 0.3 LTIs.
Near Misses Rate
Near Misses Rate is a KPI that measures the number of near-miss incidents that occur in a workplace over a given period, usually expressed as a rate per 100 employees. A near-miss is an incident that has the potential to cause harm but does not result in an injury or illness. This KPI is important because it provides insight into the potential hazards that exist in the workplace and allows organizations to take corrective actions before an incident occurs.
Equipment Breakdowns
By measuring the number of equipment breakdowns and creating a goal to improve this number, you affect both safety and production. Often when critical equipment breaks down, there’s a loss of activity.
Number of Safety Violations
This KPI measures the number of safety violations identified during an audit or inspection. A safety audit is performed by external organizations, such as OSHA (Occupational Safety and Health Administration) and it ensures that organizations comply with safety policies and standards in the workplace.
Penalties Paid
This is a compliance KPI in EHS (Environmental, Health, and Safety) management that measures the number of penalties or fines that an organization has paid as a result of non-compliance with industry laws, procedures, regulations, or standards.
Fleet Safety (Collisions per million km driven)
This KPI measures the number of collisions or accidents that occur per million kilometers driven by an organization's fleet of vehicles. It’s an important KPI because it provides insight into the safety performance of an organization's vehicle fleet, which can help prevent accidents and injuries.
By tracking this safety KPI, organizations can identify areas where they may need to improve their fleet safety policies and procedures, such as driver training or maintenance schedules. Plus, reducing the number of collisions per million kilometers driven can help to reduce costs associated with vehicle repairs, insurance claims, and lost productivity.
Examples of health KPIs in the workplace
Employee Attendance Rate
This KPI measures the percentage of employees who are present at work during their scheduled working hours. By tracking attendance rates, organizations can identify attendance-related issues early and take proactive measures to address them, such as offering flexible work arrangements or providing additional support and resources to employees.
Employee Perception of Management Commitment
This KPI for health and safety is usually measured through regular surveys. These allow an organization to understand if employees feel that what they do on a daily basis and the management objectives are on the same path.
People tend to follow procedures and instructions better if they see a connection between what they do and “the big picture.” It’s a little like running an NPS for employees.
Average Overtime Hours Per Person
This is a great KPI to help measure the average time worked by someone beyond their normal working hours. The idea is that, if you keep this number low, it can mean that an organization is successfully managing workload and reducing the chance of fatigue in the workplace.
You do want to be careful with this KPI, as it does not apply to all types of organizations and the definition of ‘overtime’ will vary per organization.
Satisfaction With Environment Score
This is something that would be measured as part of an eNPS survey. It involves obtaining employee feedback on several levels, including how satisfied they are with their physical surroundings (desk, office, noise levels, building, toilets, greenery, etc…), right through to their emotional environment.
Low scores might indicate issues that are adversely affecting the health (physical but more likely mental) of your employees.
Health and safety KPIs to measure the efficiency of your health and safety processes
Monthly health and safety Prevention Costs
This is the expenditure that will be aimed at minimizing health and safety hazards within an organization. It will include training as well as inspections and audits that will be aimed at offering conducive and safe working conditions.
Productive Days Percentage
This is a nice twist on the more negative approach of measuring things like sick days and time off work due to accidents. It flips those KPIs into a more positive approach of celebrating the number of days of productive work that were successfully delivered as a percentage of the total available working time.
For example, if your organization had 10 employees and there were only 5 days lost due to health and safety issues, your Productive Days Percentage would be 99.86%. This is how you would calculate it: (3645 days / 3650 available days) x 100 = 99.86%.
Employee Training
This KPI measures the number of training hours or sessions provided to employees to improve their knowledge and skills related to safety practices, hazard identification, and emergency response. It also helps you measure the effectiveness of the training program by evaluating the level of understanding and knowledge retention among employees.
Percentage of Management Trained in health and safety
This simple leading indicator will help you avoid many of the accidents and incidents that might otherwise occur. It also helps you understand the effectiveness of your training programs.
It's up to you to define what that health and safety looks like. But, once you've done that, it's a simple case of measuring how many managers have undergone it and expressing that as a percentage. You can do the same thing for all employees if you want to.
Average Time To Resolution of Risks and Issues
If you're using a platform to manage risks and issues (which in many cases will be directly linked to health and safety incidents), you'll be able to measure how long it takes you on average to resolve these issues from the time that they're first reported.
For example, if someone reports loose cabling in a certain part of the office, how long did it take for this to be investigated and resolved? (Hint: Cascade can help you capture risks and issues—give it a try!)
Not sure which health and safety KPIs to track? Learn how Caterpillar focused on its safety transformation while growing its business in this strategy study.
Of course, there are dozens of other KPIs you can use to measure health and safety in a work scenario. But hopefully, this should at least get you started. Here at Cascade, we LOVE KPIs!
If you’re using one of these KPIs, or perhaps others from different parts of an organization, why not see what they'd look like in Cascade and check out Cascade's KPI features?
How To Track KPIs With Cascade?
Cascade is the ultimate strategy execution platform that empowers organizations and their safety managers to execute their strategies flawlessly. Our powerful tool comes with a range of features, including extensive KPI dashboards, real-time data integration, and analytics capabilities.
Whether you’re an executive manager, COO, or specialized safety manager, Cascade provides the tools you need to make data-driven decisions and achieve your safety goals.
👉Here’s how you can track KPIs in Cascade:
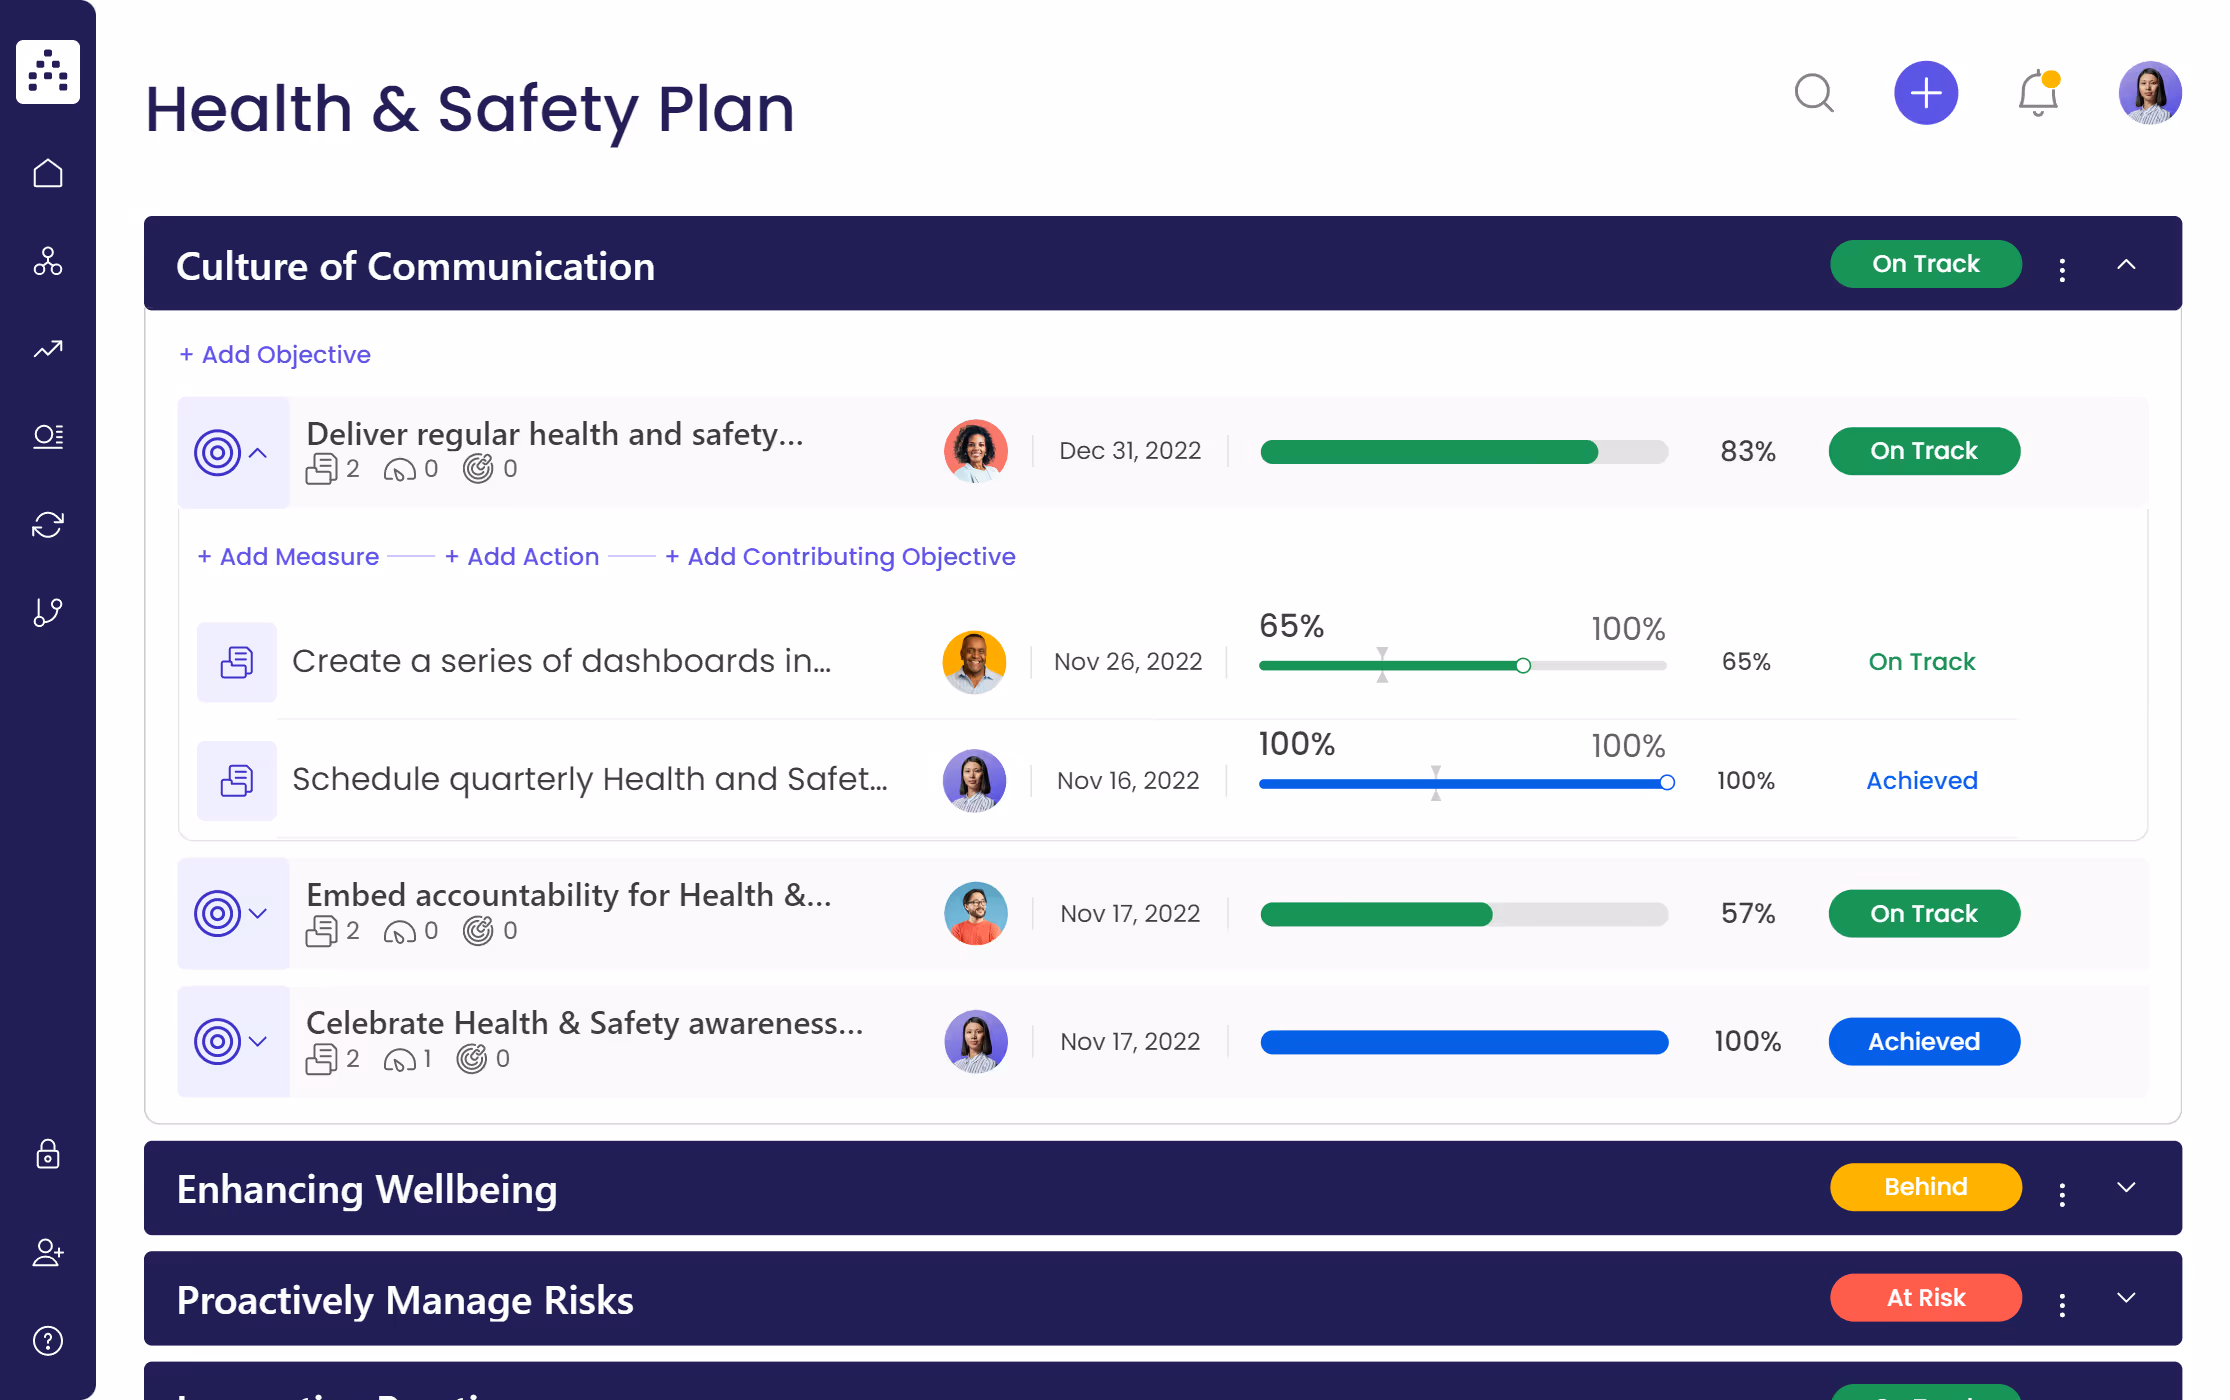
1. Get your free health and safety template
Sign up for Cascade and access your free template. The template will help you define your health and safety goals, objectives, and KPIs to measure success.
Here’s a preview of your template:
✨More related templates:
- Employee Experience Strategy Template
- Environmental Management Plan Template
- Risk Management Plan Template
- Compliance Risk Management Plan Template
2. Customize your data
While the Cascade template comes pre-filled with examples, you have the power to customize your data and safety metrics to ensure they’re relevant to your organization's needs and operations.
3. Integrate Cascade with your data sources
With Cascade, you have two options to track your KPIs: manually and automatically.
The latter option is far more efficient, as it simplifies data collection and ensures you're working with accurate and up-to-date data.
By integrating Cascade with your favorite business tools, such as Excel, Google Sheets, or Power BI, you can easily import your KPI data and keep your team in the loop.
No more worrying about manual data entry or inaccuracies—let Cascade take care of the hard work for you.
4. Bring in your team
Send an invite to your team members to collaborate on shared KPIs and ensure everyone is on the same page.
With Cascade, you can assign roles and responsibilities, set up notifications, and communicate with your teams in one place.
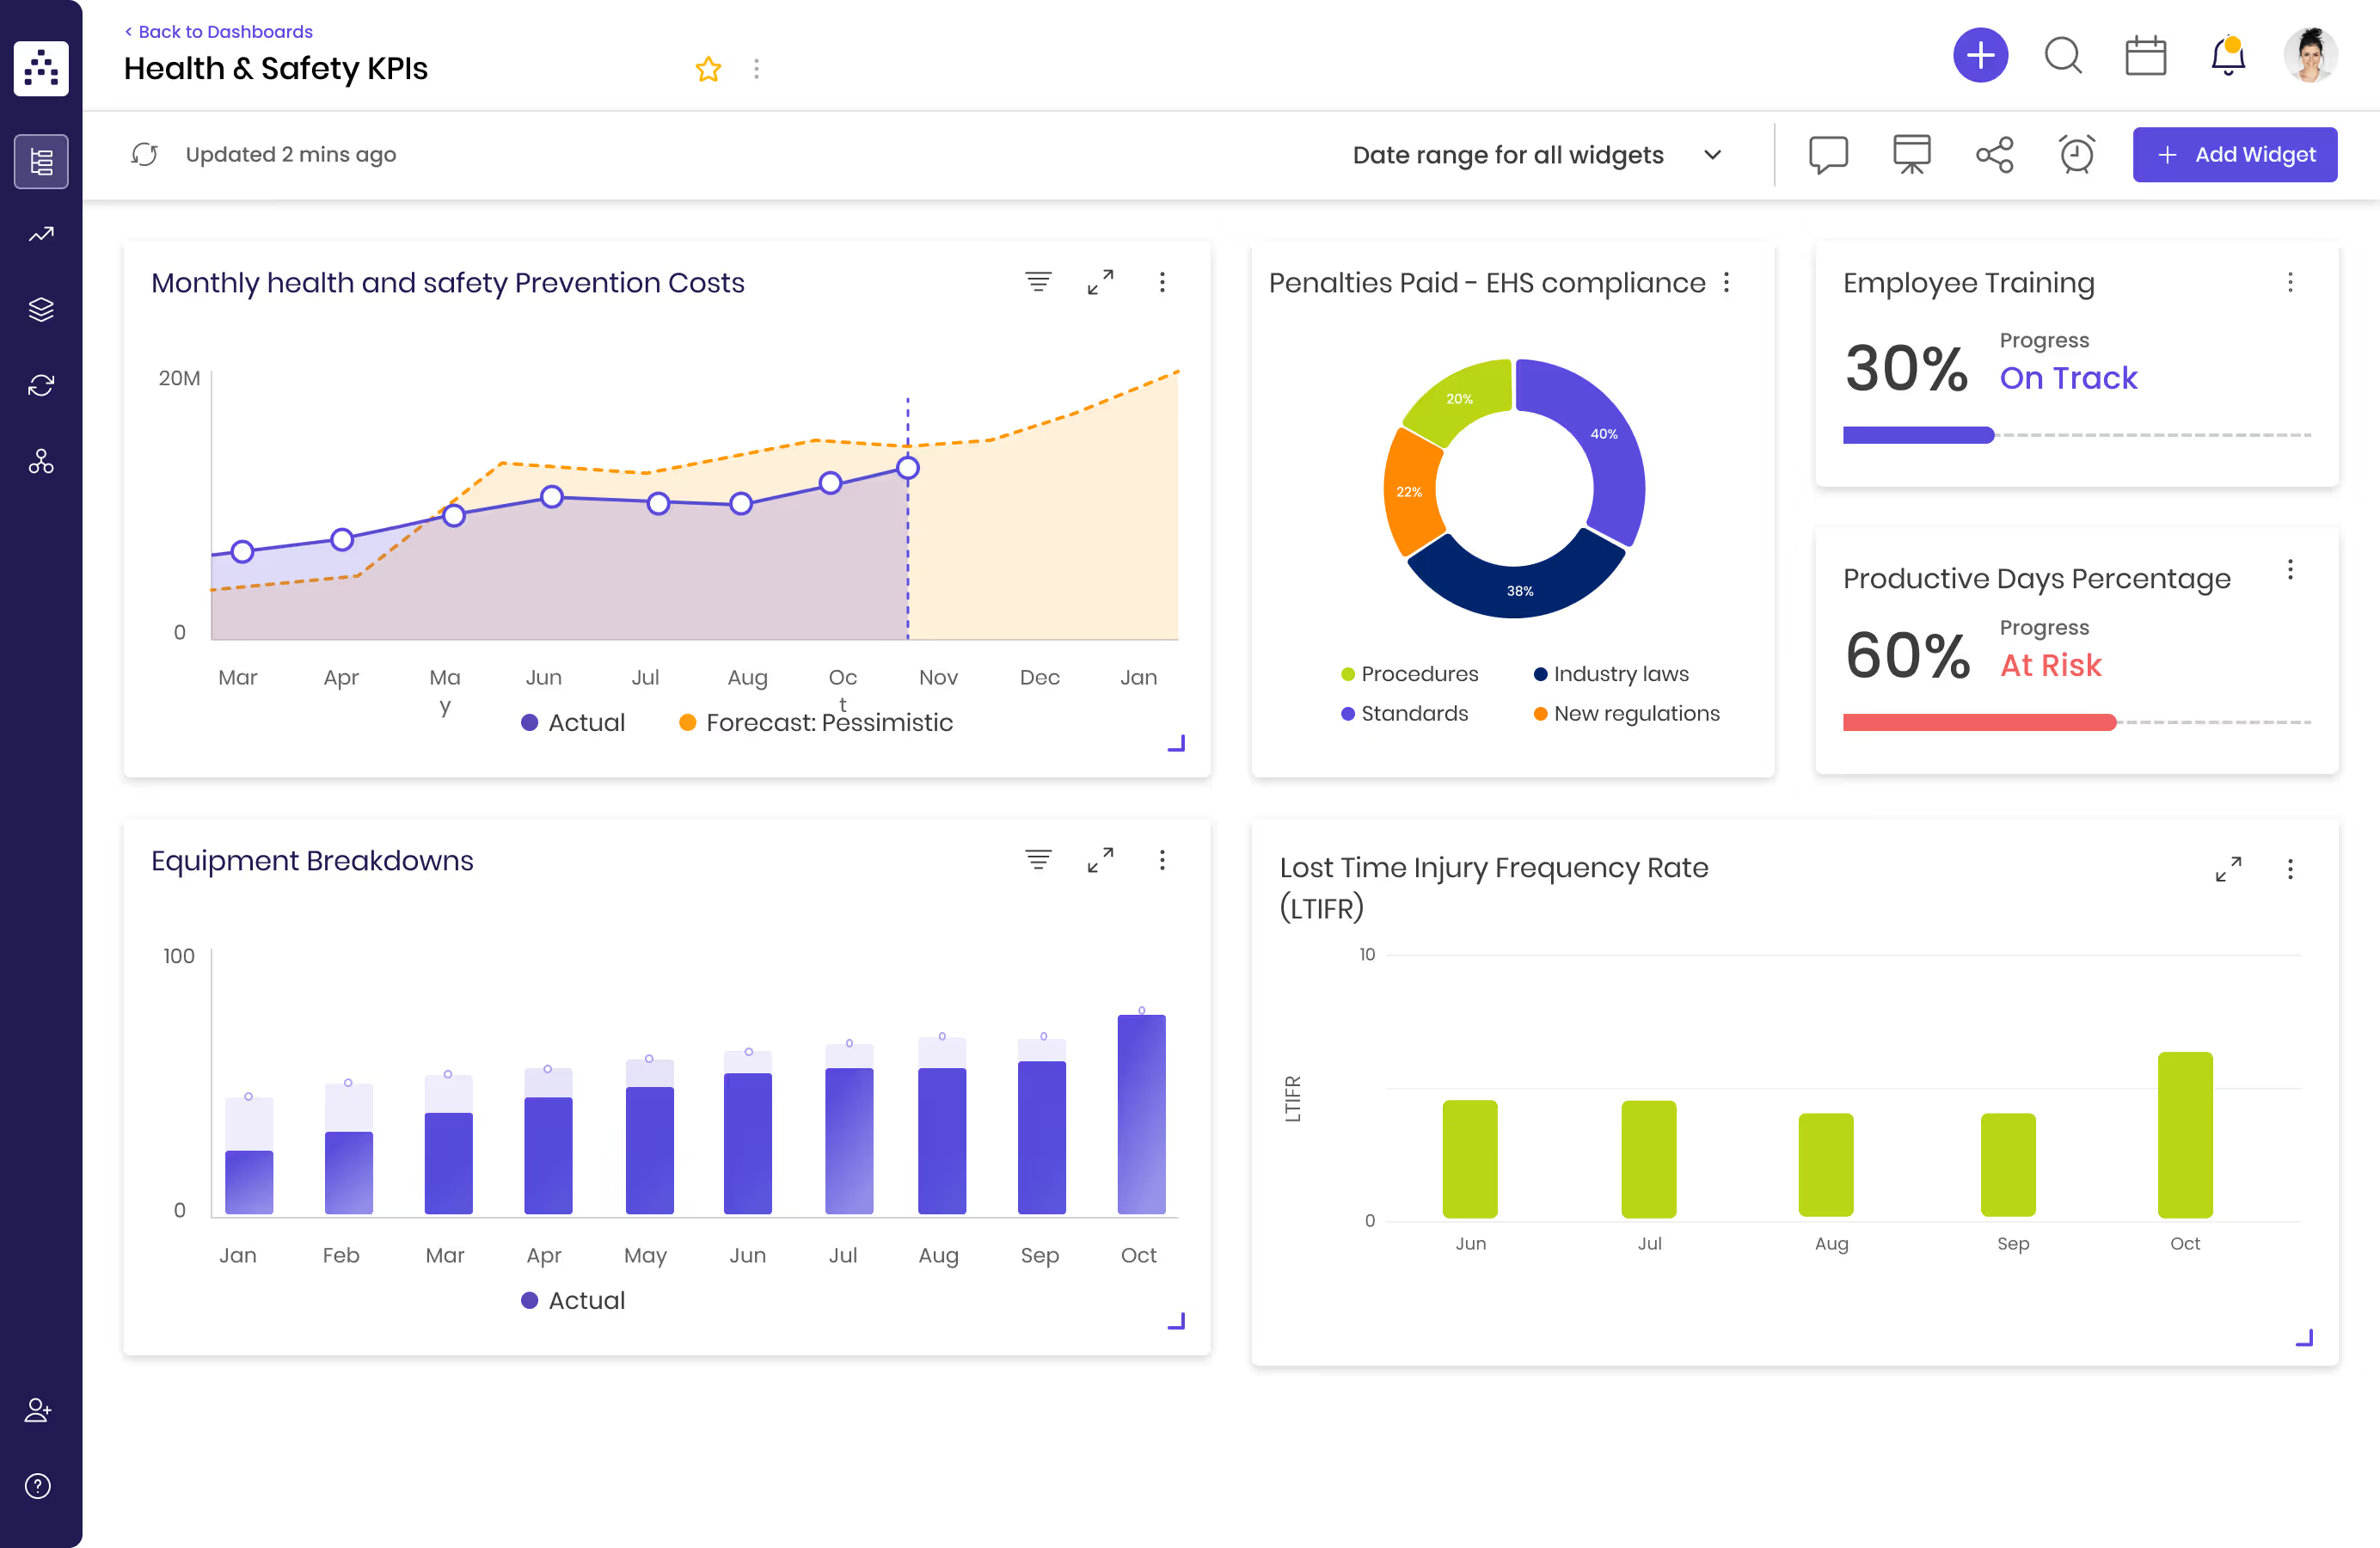
5. Start tracking performance with the dashboards and reports
Cascade's powerful dashboards provide real-time visibility into your KPIs and allow you to quickly identify areas that need attention.
With customizable widgets and drag-and-drop features, you can easily visualize and analyze key metrics to improve your safety management and safety culture.
Need to explain the “why” behind your key KPIs?
Using Cascade's strategy reports, you can choose a set of data and add context to it. By providing this context, your stakeholders will be able to make informed and data-driven decisions.

You can customize the reports to fit your specific needs, and drill down into the underlying reasons behind your safety performance.
📚Recommended reads:
Streamline Safety Performance With Cascade 🚀
Tracking KPIs is crucial for any organization that prioritizes the health and safety of its stakeholders. By measuring KPIs, organizations can identify areas that require improvement, create actionable plans, and track their progress toward achieving their health and safety goals.
Cascade is an all-in-one strategy execution platform that simplifies the process of tracking KPIs. With customizable dashboards, real-time data integration, and analytics capabilities, Cascade provides safety managers and executives with the tools they need to make data-driven decisions and streamline safety performance.
To help you get started, we've created a free health and safety strategy template that includes a range of KPI examples tailored to health and safety teams. With this template, you'll be well on your way to optimizing your processes and creating a safe work environment.
Start today for free or book a 1:1 product tour with Cascade’s in-house strategy expert.
Editor’s note: health and safety is a serious topic and the single most important thing to get right in your workplace. We're not health and safety experts, and this article is intended for information only. When it comes to implementing health and safety KPIs at your workplace, you need to get serious and speak to some experts in that space!
Health And Safety KPIs FAQs
What is the difference between leading and lagging safety KPIs?
Leading indicators help identify areas of potential risk, allowing organizations to take proactive measures to prevent incidents from occurring, while lagging indicators provide a retrospective view of safety performance, allowing organizations to identify areas where they need to focus their efforts to improve.
Examples of leading indicators include safety training completion rates, near-miss reporting rates, or safety audit compliance rates.
Examples of lagging indicators include Total Recordable Incident Rate (TRIR), Lost Time Injury Frequency Rate (LTIFR), or Injury Severity Rate.
By tracking both types of KPIs, organizations can develop a more effective safety management program and achieve better safety outcomes.
.avif)
%20(1).avif)
%20(1).avif)
.png)


