


Manufacturing is a complex process, and it must be controlled at all stages through clear manufacturing KPIs and metrics.
As this process is at the heart of what your company does, it also represents a significant risk to the investment a company has placed in its production. Poor manufacturing practices can lead to poor quality products, which will impact reputation, brand, and revenue. This is why it's crucial to constantly monitor your KPIs to understand progress, because not measuring the process will seriously affect your ability to manage it.
There are various manufacturing KPIs that you can track to help you maintain control of your processes. Tracking key performance indicators can support you in delivering consistent quality to your clients, and also ensure you utilize your resources efficiently.
We've been compiling examples of KPIs across industries and departments as part of our KPI examples mini-series - this article provides some of the most common manufacturing KPIs and also includes a brief description of why you may want to use them. In the end, we'll also show you how Cascade can be used to visualize and track your KPIs!

What Are Manufacturing KPIs?
Manufacturing Key Performance Indicators (KPIs) are essential metrics that allow you to effectively monitor and manage various aspects of your manufacturing strategy and processes. These indicators serve as benchmarks, helping you gauge the health and efficiency of your operations at every stage.
Manufacturing is a multifaceted endeavor, and KPIs provide the means to keep a firm grip on its intricacies. By tracking these performance metrics, you gain the ability to identify potential issues early, rectify deviations, and optimize processes for superior outcomes.
Manufacturing KPIs extend beyond numerical values; they encapsulate the pulse of your operations. They encompass factors like production throughput, cycle time, equipment efficiency, inventory management, and more. These indicators unveil insights into your machinery's performance, the utilization of your resources, the quality of your products, and even your ability to meet customer demands on time.
Manufacturing KPI Examples
We're here to help your business grow, so we've got a bunch of examples for you to see. Our suggestion is to choose at least two KPIs for each of your key business objectives. If you are ready to create your own KPIs, we've created an easy 4 step formula for creating great KPIs.
Machinery-Related KPIs
Machines are at the center of the manufacturing process. That’s why it's important to keep an eye on their performance and overall efficiency. There are several KPIs that you can use to effectively track this, such as:
Capacity Utilization
You invest a lot of money into machinery and production line tools, so it makes sense to utilize them to their maximum potential.
Keep a record of the capacity of your systems and track how much of that capacity you’re utilizing. The higher this number is, the better.
KPI example: Increase capacity utilization to 55% by 01/07/2025
Throughput
Efficient production is not just about capacity utilization; it's also about how much product you can actually push through your systems. Throughput measures the rate at which you can produce finished goods or deliver services, ensuring that you are maximizing your resources.
KPI example: Increase throughput by 10% by 01/09/2025
Overall Equipment Efficiency (OEE)
Is your machine performing to its optimum capacity? It's a good idea to keep track of machine efficiency so you can mark any downward trends or regular issues.
This can help you determine when the system needs maintenance or should be replaced. If you don’t track efficiency, it's much harder to establish areas of waste.
KPI example: Achieve OEE of 100% by 01/10/2025
Overall Equipment Effectiveness (OEE)
OEE combines factors like availability, performance, and quality to give you a comprehensive view of your equipment's efficiency. It helps you pinpoint areas for improvement and enhance the overall production process.
KPI example: Achieve OEE of 85% by 01/07/2025
Total Effective Equipment Performance (TEEP)
TEEP takes OEE a step further by considering all factors that impact production, including scheduled downtime and planned stops. It gives you a more realistic understanding of how well your equipment is truly performing.
KPI example: Increase TEEP to 90% by 01/06/2025
Machine Downtime
Track both scheduled and unscheduled downtime to get a clear idea of how often your systems are out of service.
Scheduled downtime and regular maintenance can reduce the number of unscheduled outages, giving you greater control and reliability in your manufacturing process.
KPI example: Reduce unscheduled downtime to 4% by 01/12/2025
Machine Set Up Time
Machine set up can eat into actual production time, which can eventually prove to be costly. It is important to track how much time it takes to set the system up, switch necessary components during production, and perform other configuration activities.
You can reduce setup time by optimizing the process and avoiding shutting down the machines for as long as possible.
KPI example: Reduce machine set up time to 15 minutes or less by 01/06/2025
Cycle Time
Time is a valuable resource in manufacturing. Cycle time measures how long it takes to complete a single production cycle, from the beginning of a process to its end. By reducing cycle time, you can increase overall productivity and respond more quickly to market demands.
KPI example: Decrease cycle time by 15% by 01/11/2025
These are some of the most important machine-related metrics to track. Maintaining peak production line efficiency can significantly reduce operating cost, improve profits, and ensure the end customer receives a good product.
👉🏻Check out our article The Ultimate Operating & Financial Model Template (Free Spreadsheet) to see some of these KPIs in action!
Inventory KPIs
The production line generates inventory and you need to keep track of it. If you produce far more or less than you can sell, it can impact your business and cut into your profits. Here are some inventory-related KPIs to track:
Inventory Turns
Modern manufacturing trends lean towards smaller and far more optimized inventory turns. This means companies will manufacture the minimum amount of product they need.
This allows them to remain flexible and redirect their resources when and where it's appropriate, and minimize the amount of money sitting in the warehouse.
KPI example: Increase inventory turn to 10 or above by 01/07/2025
Inventory Accuracy
The production line relies on a steady supply of raw materials. If the raw material falls short, you might have to halt the manufacturing line, place an order for more raw materials, and restart the process.
This is a waste of time and resources. That’s why tracking inventory accuracy is vital.
KPI example: Maintain inventory accuracy above 90% by 01/12/2025
Demand Forecasting
Accurate demand forecasting is crucial for managing inventory and production schedules. By closely monitoring customer demand trends, you can optimize your operations and prevent overstock or stockouts, ultimately improving customer satisfaction.
KPI example: Achieve 95% accuracy in demand forecasting by 01/08/2025
Days Inventory Outstanding (DIO)
DIO measures how quickly you can turn your inventory into sales. Lower DIO indicates efficient inventory management and reduces the risk of holding excess inventory.
KPI example: Decrease DIO to 25 days by 01/11/2025
Scrap Rate
Raw materials cost money, and it's normal to lose some of that material during the manufacturing process. This loss takes the form of scrap that is either discarded or re-purposed in some way.
The goal is to minimize scrap as much as possible and ensure most of the raw material is utilized in the product. That’s why you need to track the amount of scrap generated as well as the amount of raw material used.
KPI example: Reduce scrap to below 10% by 01/05/2025
Once you have all the information regarding your inventory, it's easier to keep track of your investment and the overall yield from your production line.
Logistics and Fulfillment KPIs
Efficient logistics and impeccable fulfillment lie at the heart of a thriving operation. Just as inventory management shapes success on the production line, tracking KPIs in logistics and fulfillment is paramount to ensuring optimal performance and customer satisfaction.
Total Order Fulfillment Time (days)
From order placement to delivery, the time it takes to fulfill an order impacts customer satisfaction. Tracking total order fulfillment time helps you streamline processes and meet customer expectations.
KPI example: Achieve total order fulfillment within 3 days by 01/07/2025
% of Orders within SLA
Meeting service level agreements (SLAs) is vital for maintaining customer trust. Tracking the percentage of orders delivered within SLA gives you insight into your operational efficiency.
KPI example: Ensure 95% of orders are within SLA by 01/09/2025
Order Fill Rate
Order fill rate measures the percentage of customer orders fulfilled from available inventory. A high order fill rate indicates effective inventory management and ensures customer needs are met promptly.
KPI example: Maintain an order fill rate of 98% by 01/10/2025
Quality KPIs
Quality is one of the most important metrics to track. An optimized production line is of no use if the products created don’t live up to your company's standards. Here’s a look at some of the quality KPIs you need to track:
Percentage Defect
This is the percentage of products that emerge from the production line with defects. No production line will create 100% perfect products, regardless of how stringent the production methods and quality checks are.
Defects are normal, but they need to be tracked. If there are too many defective products, you might need to look at the production process once again.
KPI example: Reduce the defect rate to below 5% by 01/10/2025
First Pass Yield
This is a metric which tracks the number of successful products that emerge from the production line without issues on their first pass. This is an indication that the design and production process is calibrated properly.
KPI example: Increase first pass yield to 95% or above by 01/04/2025
Rework
If the product has to be reworked after it has emerged from the production line, there’s something wrong with the process. Reworking consumes both time and resources and slows down your production line significantly.
KPI example: Reduce rework percentage to 4% by 01/09/2025
Failed Audits
Every reliable manufacturer will audit their end product before they send it off for sale. If the product fails during this audit, it can’t be sent to the customer, representing a waste of time and resources.
You should aim for zero failed audits and optimize your system accordingly.
KPI example: Reduce failed audits to 0 by 01/11/2025
Keeping track of quality is essential if you want to keep customers satisfied. The metrics mentioned above give you a clear idea about the quality of products and efficiency of the production line.
Financial KPIs
When it comes to manufacturing, understanding your financial health is key. In this section, we'll delve into the financial KPIs that shed light on your fiscal landscape.
Return on Assets (ROA)
Investing in manufacturing assets requires careful consideration. ROA measures the profitability of these assets by comparing the net income generated to the total value of assets. A higher ROA indicates better utilization of resources.
KPI example: Increase ROA to 12% by 01/10/2025
Manufacturing Cost as a Percentage of Revenue
Managing costs is crucial for profitability. Tracking manufacturing costs as a percentage of revenue helps you keep costs in check and ensures that your production processes are financially sustainable.
KPI example: Maintain manufacturing cost below 30% of revenue by 01/09/2025
Manufacturing Cost Per Unit
Understanding the cost of producing each unit is essential for pricing strategies and cost control. Monitoring manufacturing cost per unit helps you identify opportunities for cost reduction.
KPI example: Reduce manufacturing cost per unit by 5% by 01/08/2025
Maintenance Cost Per Unit
Regular maintenance is essential for preventing breakdowns and ensuring smooth operations. Tracking the cost of maintenance per unit produced can help you identify inefficiencies and optimize your maintenance strategies.
KPI example: Reduce maintenance cost per unit by 8% by 01/12/2025
Transportation Cost Per Order
Shipping and transportation costs impact your bottom line. Tracking transportation cost per order helps you optimize your logistics operations and minimize unnecessary expenses.
KPI example: Reduce transportation cost per order by 12% by 01/12/2025
Customer KPIs
It is possible for bad products to slip through all the quality checks and reach the customers. That’s why it is recommended to track the customer KPIs mentioned below:
On-Time Delivery
This helps keep customers happy and ensures that employees remain on schedule. Tracking this metric is especially important if you work with perishable goods.
KPI example: Increase on-time delivery rate to 95% by 01/12/2025
Customer Returns
Your goal should be to have zero customer returns, but the reality is that there will always be some.
Tracking customer returns will help you not only see how you measure up to industry standards, but also help you manage the return rate through improving your process.
KPI example: Reduce customer returns to below 7% by 01/06/2025
Customer Reviews
This is usually a metric tracked by the marketing division of a company, but a manufacturing unit should also consider keeping a track of it.
Sometimes customer reviews might contain important information that will help optimize the production process.
KPI example: Increase average customer review to 4.5 stars by 01/12/2025
You should consider customer satisfaction a priority during the manufacturing process, given that the product has a significant impact on the bottom line.
Employee KPIs
If the machines are the heart of a production line, the employees are the soul. When the latter perform well, the production line will be effective and efficient, and the quality of the product will benefit. Here are some of the employee-related metrics you need to track:
Employee Turnover
Companies often invest a substantial amount of money into training their employees. Loss of every employee can be expensive in the long run. Moreover, a higher turnover means you have more new, untrained employees in your workforce.
That can have a big impact on the overall quality of products, end the efficiency of production.
KPI example: Reduce employee turnover rate to 10% by 01/12/2025
Training Hours
Good training can improve overall efficiency, reduce turnover, and have a positive impact on the quality of products. Tracking training hours will help ensure your employees are always ahead of the curve and good at their jobs.
KPI example: Increase average yearly training hours per employee to 15 by 01/12/2025
Revenue Per Employee
Every employee should contribute meaningfully to the production line, and therefore to company revenue. Tracking revenue per employee helps you understand the overall efficiency of the human resources in your production line.
KPI example: Increase revenue per employee to $4600 by 01/08/2025
Profit Per Employee
Tracking profit per employee is also a great way to understand the value of your workforce. The higher the profit per employee the better.
KPI example: Increase profit per employee to $2600 by 01/08/2025
Health and Safety Incident Rate
Manufacturing processes can carry safety risks, especially if there’s a lot of heavy machinery involved. You should aim for this particular metric to be zero, but accidents can happen.
If you experience too many health and safety incidents, it is time to take another look at your culture and practices. A high number of health and safety incidents can lead to lower morale, staff turnover, poor reputation, and increased expenses.
KPI example: Reduce health and safety incidents to 2 per month by 01/06/2025
👉🏻Check out our article to discover other HR KPIs.
All of these KPIs will help you keep an eye on the manufacturing process and ensure it's in line with your goals.
💡Pro Tip: Not all of the metrics mentioned here will be applicable to your particular industry or company, so it's important to consider which KPIs best suit your business objectives.
How To Track Manufacturing KPIs With Cascade
Tracking Manufacturing Key Performance Indicators with Cascade is a streamlined process that empowers your business to monitor and enhance manufacturing operations effectively. Cascade serves as your comprehensive strategy execution partner, equipping you with the tools to seamlessly implement your manufacturing strategy. By using our platform, you gain real-time insights into the health and efficiency of your manufacturing processes, ultimately contributing to optimized operations.
Whether you're a top-level executive, portfolio manager, or operations lead, Cascade arms you with the capabilities to drive data-driven decisions and achieve your manufacturing objectives.
Here's your roadmap for KPI tracking in Cascade:
1. Get your free manufacturing strategy template
Begin your journey by signing up to Cascade and accessing your tailor-made template. This template acts as a starting point, guiding you through the process of selecting and tracking the most relevant KPIs for your manufacturing objectives.
Take a glimpse at your template:
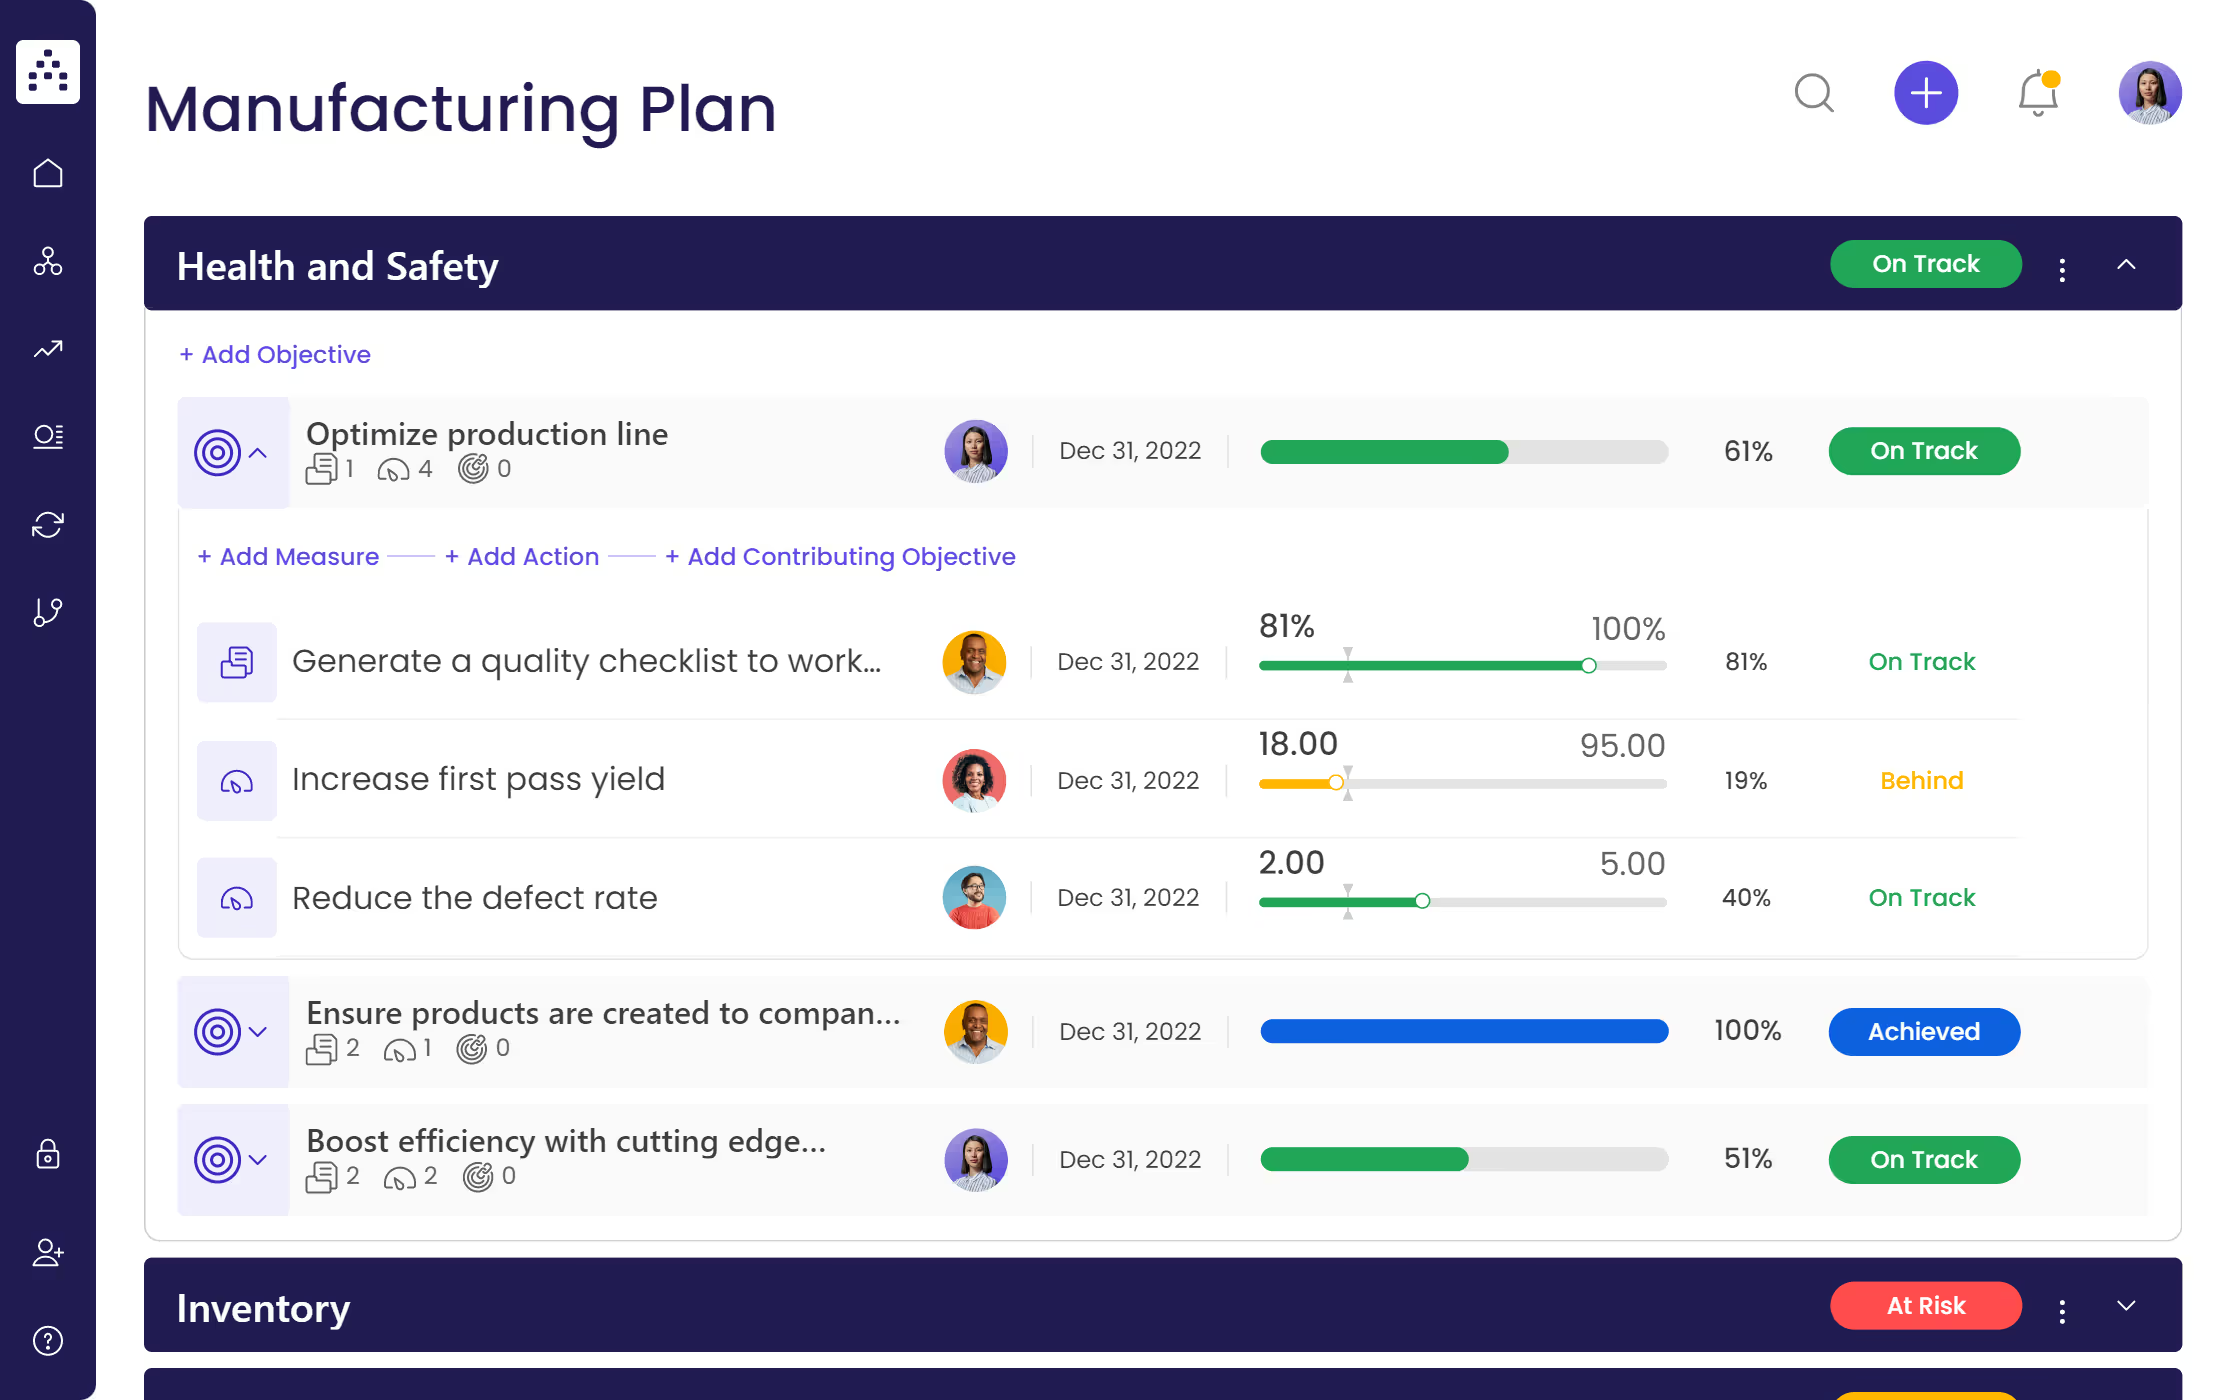
💡As you can see, it’s pre-filled with data and examples you can use as inspiration!
2. Customize your data
Tailor the manufacturing strategy template to your specific needs. Input your business's unique manufacturing goals, objectives, and data points, ensuring that your KPI tracking aligns perfectly with your operational priorities.
3. Integrate Cascade with your data sources
Cascade seamlessly integrates with your existing data sources, allowing you to effortlessly import data from your favorite tools, be it Excel, Google Sheets, or your CRM. By connecting Cascade with your data repositories, you ensure that your KPI tracking remains accurate and up-to-date, facilitating informed decision-making.
4. Rally your team
Extend invites to your team members! With shared visibility, your team can collectively monitor KPI progress, share insights, and work toward manufacturing excellence. Cascade empowers you to assign roles, delegate responsibilities, establish notifications, and facilitate seamless communication and collaboration.
5. Track performance with manufacturing KPI dashboards
Cascade's intuitive dashboards offer a visual representation of your manufacturing KPIs. Monitor your chosen metrics, track progress, and assess performance trends at a glance. The interactive nature of the dashboards enables you to delve into specific metrics, uncover patterns, and make data-driven adjustments in real-time.
.png)
By following these simple steps, you empower your business to optimize manufacturing processes, elevate operational efficiency, and achieve superior outcomes.
👉More related templates with manufacturing KPI examples:
- Lean Manufacturing Plan Template
- Manufacturing Capacity Plan Template
- Manufacturing Contingency Plan Template
- Digital Transformation Manufacturing Plan Template
- Just-In-Time (JIT) Manufacturing Template
- Green Manufacturing Strategy Template
The Key To Manufacturing Success: Real-time Tracking & Collaboration
In the dynamic world of manufacturing, the hidden gem of success lies in the seamless fusion of real-time tracking and collaborative power. As industries evolve, those who embrace this dynamic duo position themselves at the forefront of innovation and operational efficiency.
With Cascade, your manufacturing journey becomes a bold stride toward excellence. Cascade empowers leaders and managers to seamlessly track KPIs, collaborate effortlessly with their teams, and meticulously dissect performance metrics, all within one powerful platform.
Real-time tracking gives you an immediate pulse on your operations, empowering quick adaptation and well-informed decisions. When coupled with effortless collaboration, the synergy among your teams breaks down barriers, ushering in an era of unified expertise and seamless progress.
Ready to kick it off? Start today with a free forever plan or book a 1:1 product tour with Cascade’s in-house strategy expert.

.png)
.avif)
.png)


