Microsoft Excel
Zapier is a powerful integration platform that seamlessly connects thousands of tools with each other, including Cascade!
All you need to get started is a Cascade Premium or Enterprise subscription and a Zapier account.
Microsoft Excel
Trigger

Cascade Action
Microsoft Excel
Action
How does the integration work?
Using Zapier, Cascade allows you to update several important pieces of information from any app avalible on Zapier, such as:
- Update Action Current Progress
- Update Measure Current Value
- Update Measure Historical Value
Note: Cascade’s Zapier integration is currently in Beta. We are actively working on adding new Capabilities, Triggers and Actions. Stay tuned for more soon!
What is
Microsoft Excel
?
Have a single source of truth for all your data with Cascade. Sync your Excel data to Cascade. Give more business context to your data while also avoiding manual work.
Ready to get started with Zapier?
If you already have a Cascade Premium or Enterprise subscription and you’re ready to get creative, you get started now with Zapier!
How to set up Excel in Cascade
Note: You can also connect to Excel from the "Metrics" page, and import the metrics that're captured in your spreadsheets into Cascade. These imported metrics can then be connected to measures to track progress here. See Import your Metrics from Microsoft Excel for details.
You can link your Cascade measures to a spreadsheet, and let Cascade update the measure's progress for you, and thereby your objectives, dynamically and automatically. For example, when you need to track measures like "Budget allocation and expense forecast for FY2022", "Student engagement in first-year activities", "Number of patients using biomarkers", "Maintain Vendor SLA compliance", and so on which is maintained in an excel, you can simply get the data here in Cascade with this integration.
Every time the value in Excel changes, your measure's progress will change too. This makes it easy for your team to see the objective's latest health. This integration with Excel provides a hassle-free, and a makes an otherwise tedious data entry work a lot smoother.
Before you establish the connection, it is important that these pre-requisites are met:
- A 'Measure' that is associated to your 'Objective' in the plan that you created in Cascade, and want to link to your spreadsheet.
- A Microsoft 365 business account synced with OneDrive or SharePoint.
- An .xlsx spreadsheet in the account, with goal-progress values and easily-identifiable column titles. Something like this:DateMeasure NameTotal RevenueTotal ExpenditureMeasure Progress05/28/20225 million in profit2,000,0001,000,00020%
Please note that you cannot pinpoint to a single cell, but rather to a column where you're updating progress.
Once you ensure that these are met, you can start integrating with Excel. This can be done in two ways:
- From Integrations > Metrics & measures.
- Click Add Tracking against the 'Measure' from the Plan Details area of the Planner page.
How to integrate Microsoft Excel with Cascade?
Click Metrics and Measures tab from your Integrations page. Click Connect to start integrating. In the Connection Name field, enter the name and choose whether it will be a private or shared connection.
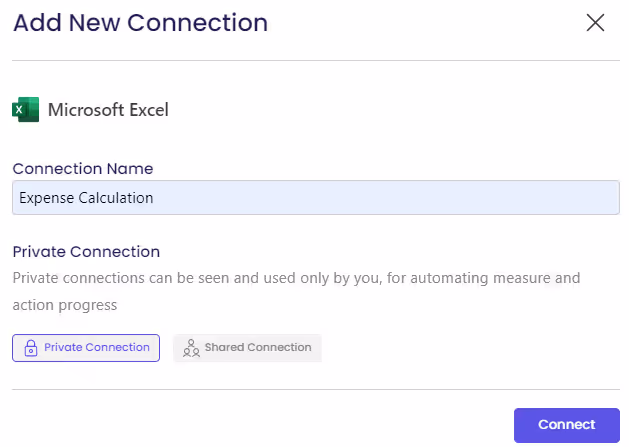
Note: A private connection can be used by only the person who created it, while a shared connection can be seen and used by everyone in your account for automating measure and action progress.
Click Connect. A new window opens. Follow Microsoft Office's instructions to connect your Excel account. When you've finished, click Accept.
You've successfully integrated Excel. You can now start managing your measures, and track their progress with Excel.
How to track progress with Excel-Cascade integration?
When you click Add Tracking, the Edit Measure window opens.
Under the Tracking section, select Microsoft Excel from the drop-down list.
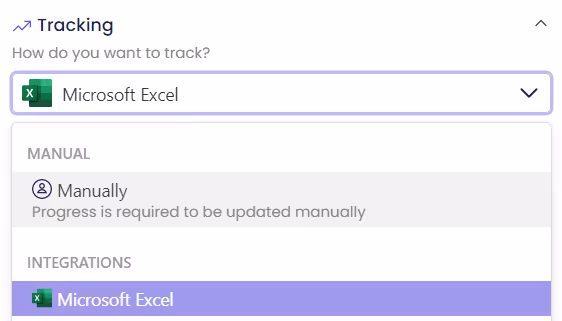
Once you select Microsoft Excel, you will see a list of related fields beneath it.

- Select Connection: Click Add new connection to add a new connection, or select an existing connection from the drop-down list.
- Select File: Choose the excel file that you need to connect to from the drop-down list. This list will display all the excel files that are available in your OneDrive or SharePoint.
- Select Sheet: Choose the appropriate sheet from the list.
- Date Column: Choose the column in which you've the dates, from the list. Please note that the cells in the date column in your sheet must be set to "date format".
- Progress Column: Choose the column in which you've your progress mentioned.
- (Optional) Target Column: Choose the column in which you've the target mentioned. If this is specified, then the goalhub will display these values as target, and will not calculate it based on the "Update Schedule".
- Data set-up: Select the way the data is set-up in your excel.
- Cumulatively - If the progress in your excel is cumulative, i.e., if you've already done the calculation in the excel sheet to obtain cumulative values, then select this option.
- Non-Cumulatively - If you've just updated the actual progress made on a particular date, and have not summed up the previous values, then select this option.
Irrespective of whatever option you choose here, we'll calculate the cumulative value for you, and display here. Depending on the new values added at the latest date, the progress gets updated. This option helps to understand from the respective goal hub, the progress made over a period of time, i.e. the historical trend, since the progress is taken from the values entered over different dates.
- Under What does success look like area, select the Target type, Initial and Target values that you wish, and finally choose the Unit from the list. If you wish to customize the tracking by "maintaining" specific targets, then select Maintain between or Maintain above or Maintain below from the Target type dropdown. See Customize Tracking for your Measures for details.
Click Save. You have now successfully enabled the tracking. All you need to do now is, just change the values in excel and see the progress getting updated automatically.
Cumulative Data Set-up: ProgressNon-Cumulative Data Set-up: Progress
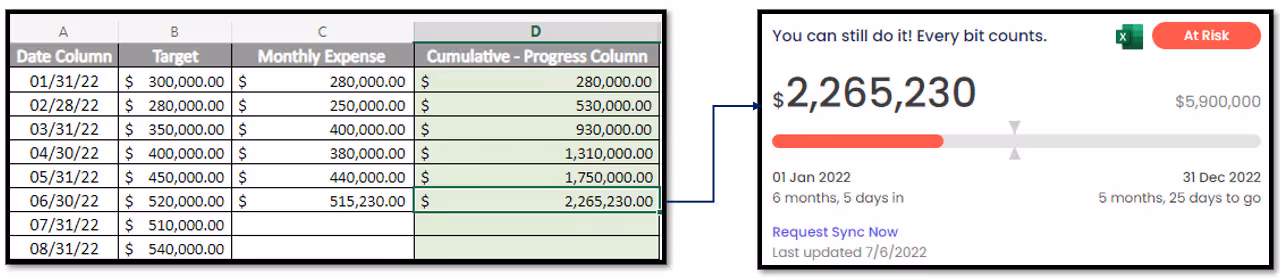

The sync happens every one hour, and you can click Refresh Sync Now to poll the data immediately.
Attached is a sample excel which you can download and upload to your SharePoint or OneDrive and play around.
In this excel, you'll see two sheets - "Cumulative Setup" and "Noncumulative Setup". Use the respective sheets, and feel free to change the values in the sheets to understand how the integration works.
FAQs
Can I use the same Excel file for updating multiple data?
Yes, you can set up the file with different data (ARR, Pipeline, Churn, NPS, etc.) in different sheets. You can name the sheets relevantly so that it'll be easy for you to enter the details when you try integrating. The same file can be integrated with multiple measures for tracking each data. Once the data is updated in the sheets, it'll automatically update all the relevant measures.
Does data in Cascade affect Excel?
No. The Excel integration is a one-way connection: from Excel to Cascade. Nothing you do in Cascade will change Excel values.
I'm getting a "Connection does not work" error message.
Check if the connection is a private or shared connection. If a connection is private, then you might see this error. If its a shared connection, and you still see this error, then the best option is to delete the connection and reconnect. Go to Integrations and use the trash icon to delete the connection. Follow the preceding instructions to set up a new connection.
My data is not showing up.
The cell that you link to Cascade can have only numbers and related characters, like percent and currency signs. Check the cell to make sure there are no letters or special characters. Ensure you are logged into a Microsoft 365 business account, not a personal account.
I am a collaborator for the measure, can I download the excel from Cascade?
No, as mentioned, it is a one-way connection. You need to request the owner to give you shared permissions on the excel file in OneDrive or SharePoint.
I use the desktop application of Microsoft Excel. Will the data still sync?
It is important that you sync this file in your local to OneDrive or SharePoint, else this will not work.
What happens if I accidentally delete the data in the pinpointed column or junk characters are displayed?
You must either see the last shown value or an error message. If either of this is not seen please contact support and we will get it resolved for you.
What to do when the integration says there's an API error?
There is nothing that you can do while facing an API error. Contact our live support, and let us know the steps that you did before facing this issue so that we can debug and resolve.
I have connected my measures to Excel sheets and tracking it already, but now this functionality seems interesting, how do I transition to this? Will this mean, I'll lose the data and progress that was made till date?
You can simply import the metrics using the same spreadsheet, and then hook the measures up to those metrics. And, from the tracking section, choose tracking type as Metric library, and select the metric. See Connect your Imported Metrics to Measures for the steps.
The spreadsheet is the source of truth, so if you've the historical data there, it'll translate to the measure once connected.