


Executive dashboards are a must-have tool that help you and your team uncover business insights to address risks, double down on what works, and drive growth.
But that’s only true when they give your real-time data and structure that’s simple and easy to digest.
In this article, we'll show you different examples of executive dashboards tailored to specific roles. We’ll also share best practices for creating dashboards that are actually usable.
Plus, we will give you free templates and show you how to build powerful dashboards in Cascade to track your custom metrics.

What Is An Executive Dashboard?
An executive dashboard is a visual reporting tool executives use to get a high-level view of the organizational performance as measured by strategic key performance indicators (KPIs). And it does so with an interactive user interface that makes it easy to drill down into data sets and uncover deeper strategic insights.
Whether you call it a strategic dashboard or a KPI dashboard, the main goal is to help executive teams make confident and data-driven decisions on their next strategic move.
.png)
By analyzing data presented in an executive dashboard, businesses can spot ongoing trends, understand complex data sets, and identify organizational bottlenecks. Armed with this information, managers and decision-makers can reverse-engineer the strategies and tactics that are driving the business's success.
5 Executive Dashboard Examples
We’ve rounded five examples and templates for you to measure and gain strategic insights to understand whether you need to adapt your strategy. Plus, we added a list of metrics that you can add to each dashboard. What you’ll include on your dashboard, depends on your goals and the insights you seek.
CEO dashboard
As a CEO, you're faced with a tricky balancing act—achieving immediate results while staying laser-focused on your business's future growth. This requires you to make strategic trade-offs every single day, while ensuring everyone in your organization works toward the same strategic objectives.
To achieve this, you need to have a finger on the pulse of your business.
With the right executive dashboard, you can access real-time information that provides a bird's-eye view of your company's performance. It creates a single source of truth that lets you see what's working and what's not, and identify areas for improvement.
No more guessing, no more waiting for the next quarterly review—just real-time, actionable data for confident strategic decision-making.
CEO dashboard example:
.avif)
Some examples of the key metrics you should be tracking include:
- Revenue and profitability: Current revenue, revenue growth, EBITDA, gross profit margin, and net profit margin.
- Sales and marketing: Conversion rates, customer acquisition costs, pipeline growth, market share of the business and various products, and customer retention rates.
- Operations: Inventory turnover, supply chain efficiency, production output, and quality control.
- Financial health: Cash flow, working capital, debt levels, and capital expenditures.
- Strategic initiatives: KPIs related to key strategic initiatives and projects, such as new product launches, acquisitions, or geographic expansion.
👉 Get your free corporate strategy template. You’ll be able to outline your company’s strategic goals and build dashboards to stay on top of your key metrics.
CFO dashboard
In a survey of 450 finance leaders, 99% said it’s important to have real-time processes and operations in place to inform better business decisions. Shockingly, only 16% of CFOs said that more than 80% of their current finance processes and operations are tracked in real time.
But, if you are serious about maximizing profitability and avoiding wasteful spending, you need up-to-the-minute information. There’s no excuse for flying blind.
That’s where Cascade’s dashboards come in. A financial dashboard brings the most important financial performance indicators under one roof and provides real-time insights to make confident decisions.
CFO dashboard example:
.jpg)
Here are examples of financial metrics that you can include on your dashboard:
- Gross and Net Profit Margins
- Budget (Target vs. Actual)
- Quick ratio
- Current ratio
- Working capital
- Cash runway
- Cash conversion cycle
- Operating cash flow
- Total debt to equity ratio
- EBITDA
- Accounts payable and accounts receivable turnover
Using Cascade dashboards and integration capabilities, you get to assess and manage risks before they become a serious threat to the company’s financial health. You can also identify opportunities for operational efficiency that will help cut costs and improve the bottom line.
With real-time financial data, you can make confident business decisions on the spot without diving into extensive static spreadsheets (that become outdated by the second) and analyzing vast volumes of fiscal figures.
👉 To help you create a tailored financial dashboard, we’ve created a Finance Strategy Template. With this template, you can track key financial KPIs in one place and ensure that your financial operations are aligned with the overall business strategy.
COO dashboard
As a crucial link between strategic initiatives and on-the-ground execution, you must have clear visibility into how business goals translate into operational strategies. You must be on top of operational plans and resolve roadblocks as they occur. And you must be able to pivot quickly if circumstances demand so.
To do so, your operational dashboard should be designed to make operational problems obvious so you know exactly where to look to help your teams to improve processes. In Cascade’s dashboard, you get real-time data so you can quickly identify underperforming areas and act before it’s too late.
COO dashboard example:
.jpg)
Operational KPIs vary greatly across different industries, and a COO dashboard should reflect these specific metrics to give you real-time accurate insights. Here are some examples of key metrics every COO must measure:
- Financial metrics: Current accounts receivable, current accounts payable, operating cash flow, quick ratio, expenses separated into categories, and working capital.
- Production metrics: Throughput, total cycle time, first pass yield, equipment utilization, and overall equipment effectiveness (OEE).
- Personnel metrics: Absenteeism rate, high performer turnover rate, and training investment per employee.
👉 To help you achieve operational excellence, we've created an Operational Strategy Template that will align your team's inter-departmental goals and achieve company objectives efficiently and quickly. Check it out and create your real-time dashboards for free.
CMO dashboard
Do more with less. The nightmare of every CMO. If you want to prioritize your marketing efforts and effectively use your available resources, you need to have a clear understanding of which strategies work and which don’t.
With a well-structured marketing dashboard, you can keep a watchful eye on the performance of your marketing and social media campaigns, and pinpoint the strategies that generate the most leads while keeping costs under control.
CMO dashboard example:
.avif)
Some of the key metrics that you can include in a marketing dashboard are:
- Sales pipeline
- Conversion Rate by Channel
- Marketing Return on Investments (ROI)
- Cost per Lead (CPL)
- Return on Ad Spend (ROAS)
- Customer Acquisition Costs (CAC)
- Churn rate
👉 Increase the chances for success of your marketing initiatives with a Marketing Strategy Template. Our free template will help you create real-time marketing dashboards and ensure your marketing plans are aligned with business objectives.
CIO dashboard
As a CIO, you need to show the business value of your IT initiatives so that you can prove yourself as a strategic partner. This is where the CIO dashboard is your powerful ally. It collects all IT KPIs in one place, providing insights that help you drive the execution of your IT strategy while staying aligned with business goals.
With the right dashboard, you can focus on IT projects with the greatest potential for ROI, maximize their value, and ensure efficient use of resources.
CIO dashboard example:
.avif)
Some of these key IT metrics include:
- Project status
- On-time completed projects
- Number of change requests
- Server downtime
- Tickets handled
- Security Incidents
- Security Updates
Depending on your specific role, you may need to track other metrics as well. The key is to keep your dashboard simple and streamlined, so you can quickly gain valuable insights that help you make informed decisions.
As part of your role, you could also be responsible for overseeing digital transformation programs. A robust CIO dashboard can give you a clear picture of the progress and impact of these digital initiatives on business outcomes.
👉Create powerful dashboards and an easy-to-execute IT strategy plan with our IT Strategy Template. With this free template, you can streamline workflows and stay on top of performance with dashboards tailored to your needs.
💡Remember: While we have provided some examples of metrics and KPIs that can be included on executive dashboards, it's important to keep in mind that each organization is unique and has its own set of goals and priorities. You should tailor the selection of metrics and KPIs to the specific objectives of your organization.
Executive Reporting And Executive Dashboards Best Practices
Executive dashboards are extremely useful for helping C-suite and executive teams gain business intelligence related to the company’s operations and market standing. To ensure that your dashboard is effective, follow these best practices if you're building one yourself, or share these tips with your team if they're creating it for you.
Keep it simple: Stick to key metrics
Aim for simplicity by focusing on the most relevant performance metrics that truly represent your team's work, highlight areas of growth, and demonstrate strategic progress. This approach will not only provide clarity but also help to drive action and informed decision-making.
Customize your dashboard to your audience
Ask people within the organization what data will help them improve their performance. Match this with the KPIs that will give an executive summary and allow for data analytics opportunities.
By aligning your reporting dashboard with the needs of your stakeholders, you can ensure that it becomes an indispensable tool for driving performance and achieving success.
Use visuals
You know what they say: a picture paints a thousand words. When presenting data in Cascade dashboards, you can use various charts and graphs to help readers quickly grasp the information and make accurate, well-informed decisions. But be careful to stick to a minimalist design and visual representation that’s not too cluttered.
Add context to your dashboard
Add notes that describe the purpose or source of the data point to further clarify the information presented. Cascade’s Note Widget is perfect for this since it allows you to write notes, messages, and context to items on your dashboard.
Integrate your existing data sources
A dashboard shouldn’t operate in silos. Integrating it with your existing business tools ensures it can capture data accurately and automatically, so you don’t have to rely on tedious manual data entry that’s prone to user errors.
Cascade supports multiple integrations, allowing you to build robust analytical dashboards with extensive functionality.
Use the right dashboard tools
When creating an executive dashboard, don’t settle for spreadsheets or presentation tools. You need a dashboard software solution that understands your requirements and provide real-time data that’s interactive and intuitive.
Cascade not only pulls data in real time but also provides powerful filters so you can customize data visualizations to see the most important and pressing metrics relevant to your organization.
How To Set Up Executive Dashboards?
Cascade is a robust strategy execution platform that easily lets you set up real-time dashboards so you can track how teams are executing strategies and progressing toward company goals. You can achieve this in two ways:
- Option 1: Create your strategic objectives, assign KPIs, and visualize progress through dashboards.
- Option 2: Import your key metrics, analyze performance through dashboards, and make fast, confident, and data-driven decisions.
Option 1: Connect your KPIs with strategic objectives
1. Get your template
Cascade offers a wide range of templates for different aspects of the organization, such as corporate strategy, marketing strategy, operations strategy, and many others. Get the right template for your department and needs.
✨Some related templates to help you build your dashboard:
- Corporate strategy template
- Finance strategy template
- Operational strategy template
- IT strategy template
- Supply chain strategy template
- Balanced scorecard template
2. Customize the template with your data
Once you've chosen a template, it's time to populate it with your company's data. Cascade provides pre-filled dummy data to guide you, but you'll need to customize it with the metrics that matter most to your organization.
3. Integrate it with your business tools
Save time and avoid errors by integrating your business tools like Excel, Google Sheets, or your customer relationship management (CRM). With automation, you can ensure the accuracy of your KPIs at any given time.
4. Build customizable dashboards
Once you have your data in one place, Cascade's drag-and-drop widgets let you build customizable dashboards that focus on what's most important. Keep track of the metrics that matter most to you, and simplify your dashboard design to avoid feeling overwhelmed by too much data.
Option 2: Get a head start with the Metrics Library
1. Import your metrics in the Metrics Library
To import your metrics into the Metrics Library and start monitoring them immediately, follow these steps:
- Establish the connection between the Google Sheets and Cascade.
- Choose the file and the sheet you want to import.
- Select the metrics you want to track and define formats.
After completing the above steps, your metrics will be added to the Metrics Library, and you can begin building your dashboards to analyze your performance.
💡Important to note: Data automatically changes in Cascade if there’s a change in the Google Sheet.
2. Create a dashboard
Once your data is in Cascade, you can create different charts to visualize how an imported metric has progressed over time.
Here’s an example of a "Performance of Single Metric" widget:
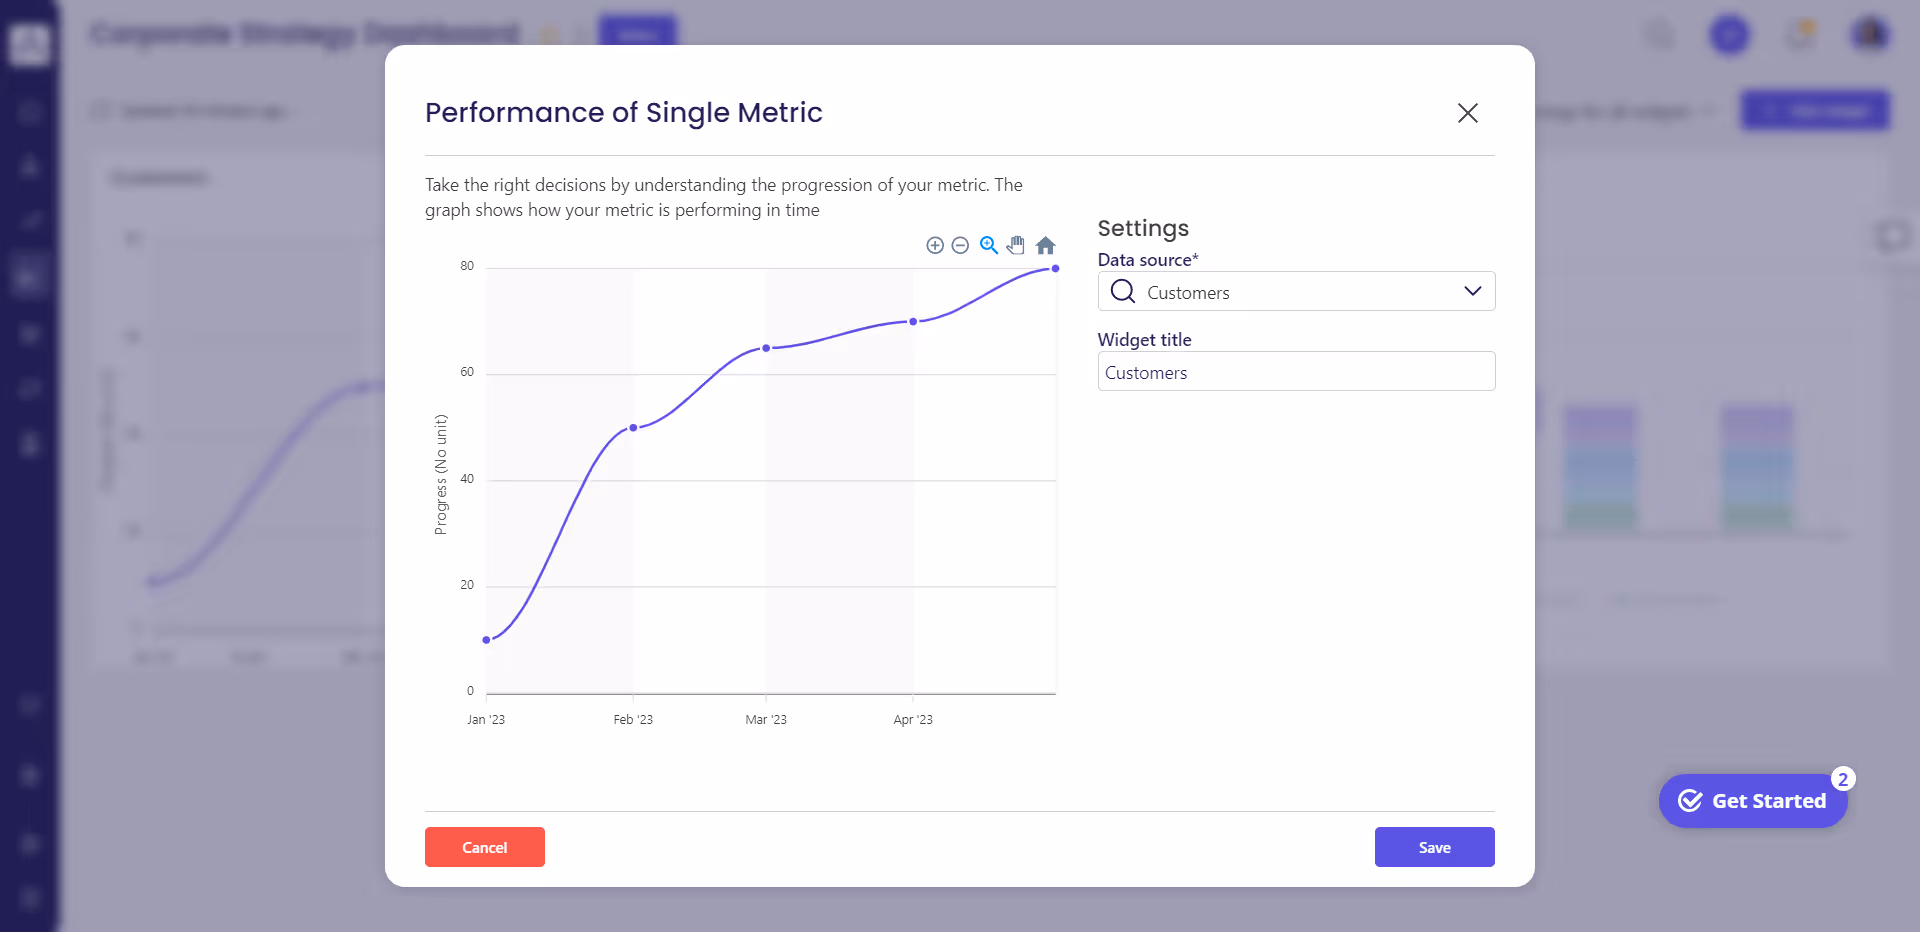
Improve your KPIs by taking action based on your metric's performance. Cascade lets you build an action plan and monitor progress in real-time without having to switch to other tools or lose visibility.
Benefits of Executive Dashboards
As a top-level company executive, it's crucial to have an executive dashboard because, without one, your business is likely to fail. A lack of alignment, visibility, or accountability at any level can lead to missed targets, duplication of effort, and inconsistent delivery, causing your business to miss out on significant opportunities for success. Some of the benefits of using executive dashboards in Cascade include:
- Strategic instinct: Dashboards provide you with a holistic view of the company’s performance, empowering you to make strategic decisions based on your experience and expertise. You'll have a better sense of what's working, what's not, and what to do next.
- Fast adaptability: With real-time data, you can quickly adjust strategies and tactics to respond to changing market conditions and emerging trends. Don’t get left behind—use your data to stay ahead.
- Alignment of strategy and execution: Tracking KPIs against company goals ensures everyone is working towards the same objectives and resources are allocated accordingly.
- Real-time visibility into performance: You’ll gain an updated understanding of company performance and quickly identify areas to improve or celebrate success. No more waiting around for monthly reports or relying on gut instincts.
- Data-driven decision-making and cost optimization: Making informed decisions based on data insights reduces the risk of costly mistakes and increases profitability and efficiency.
- Time savings: Having all KPIs in one place eliminates the need to manually gather data from multiple sources. That frees you up to focus on analyzing and interpreting data—and take action based on it.
- Accountability: Clearly tracking KPIs enables you to identify issues amongst departments and individuals and keep them accountable for their progress.
Build Your Executive Dashboards With Cascade 🚀
In today’s fast-paced business environment, you can’t afford to be in the dark about your company’s performance. That’s why executive dashboards are a critical tool for busy C-level professionals. They let you drill down on important business metrics so you can see company performance at a granular level.
With an executive dashboard, you can stay on top of strategic objectives and your team’s progress, ensuring that everything is rowing in the right direction. No more guessing or waiting until the next formal annual business review to know what's happening.
Executive dashboards will give you the data you need when you need it, so you can act accordingly. To help you get started, we’ve created free templates with sample KPIs.
Start today for free or book a 1:1 product tour with Cascade’s in-house strategy expert.
%20(1).avif)
%20(1).avif)
.png)