

.avif)
Think of a strategy dashboard as a control panel that helps organizations track their progress toward strategic goals, spot trends, and adapt to business changes.
The absence of a well-structured dashboard leaves you blind to emerging risks and disconnects your decision-making from the organization's actual performance.
Imagine missing a critical red flag that could have been easily spotted with the right tools or failing to capitalize on a golden opportunity due to a lack of visibility.
These scenarios are common in businesses where existing tools are insufficient for monitoring performance. The consequences? Hindered growth, unmet goals, and strategic missteps.
After working with dozens of customers, strategy officers, and business leaders, we’ve noticed one question that comes up often: “How do you create an effective strategy dashboard?”
We’re here to answer that question today, irrespective of whether you use our strategy execution platform, Cascade.
In this article, we’ll detail different types of dashboards, showcase various dashboard examples, and offer best practices for crafting a dashboard that aligns with your needs.
Here's a list of the dashboards we’ll cover:
- Strategy Dashboard For Boards
- Strategy Dashboard For Your Team
- Strategy Dashboard For The Public
- Strategy Dashboard For The Division
- Strategy Dashboard For Your Boss

So, let's start with the most crucial question of all.
Who Is The Strategy Dashboard For?
Dashboards that aren’t tailored to the specific needs of their users often include irrelevant information. This lack of customization hinders decision-making as decision-makers waste time sifting through irrelevant data to find what they need.
The audience of your dashboard has a significant impact on its creation. You should identify the specific group or individuals who will be using the dashboard.
Are they board members, executives, managers, frontline staff, or external stakeholders? Understanding their role in the organization and how they will use the data is key.
💡Here are some additional questions to help you define what to include in your dashboard:
- What decisions does the audience need to make with the data provided?
- What are their key performance indicators (KPIs) and business goals?
- Does the audience need high-level summaries or detailed, granular data?
- Is real-time data necessary, or are periodic updates sufficient?
- What is the best way to visualize the data for this audience?
- Do they need the ability to interact with the data, such as filtering, drilling down, or adjusting parameters?
We've structured this article around the most common audiences we're asked about. Even if your specific needs differ, you will likely find a close enough match in the list below. 👇
1. Strategy Dashboard For Boards
Our customers often need strategy dashboards designed for board members. Typically, this task falls to the CEO or the Head of Strategy, and they come to us with a request that goes something like this:
“I need to create a strategy dashboard for my board. They're very visual people and I want to keep it at a high level. I don't want them to dig too deep into any particular area of the strategy, but I want to give them enough information so that they have full confidence in what we're doing.”
Does this sound familiar? Let's explore how you can effectively build a strategy dashboard for this group:
What is the board’s role?
Boards maintain general accountability for an organization's CEO and senior leadership. They focus on the business’s critical success factors and strategic progress.
They also help pinpoint and resolve issues that may threaten the organization. CEOs must keep their boards updated and informed with accurate information.
📚Recommended read: 7 Tips For Better Board Reporting
What outcome do you want when they look at your strategy dashboard?
A strategy dashboard should reassure board members that the organization's strategy is well managed. It needs to show that you're effectively tracking key performance indicators (KPIs) and are aware of significant issues that could affect success.
The dashboard should provide a comprehensive yet concise overview of the data, enabling board members to make informed decisions without getting lost in excessive detail.
It should also highlight the organization's achievements and any critical issues requiring board intervention. This way, dashboards and board reports become pivotal tools for informed decision-making and strategic oversight.
Best practices for creating a strategy dashboard for board members
When creating a business dashboard for the board, keep these points in mind:
- Emphasize visual elements: Boards prefer visuals because they give a concise, high-level overview and illustrate trends over time.
- Balance detail level: Provide enough information to be clear and transparent, but not so much that it becomes overwhelming.
- Focus on strategic alignment: Since boards usually focus on medium to long-term strategic plans, it’s crucial to illustrate how the company is progressing towards its strategic objectives over time.
- Add current priorities at the top of your dashboard: Be aware of the board's current focus areas or specific interests and ensure your management dashboard reports on these 'flavors of the month.'
Here's an example of a Company Overview Dashboard in Cascade:
%20(1).avif)
👉Is your organization using a balanced scorecard framework to monitor performance? Discover how to create dashboards in Cascade for your balanced scorecard in this article.
2. Strategy Dashboard For Your Team
The second type of strategy dashboard we often see requested is for internal team use:
“I need to create a strategy dashboard for my team’s monthly meetings. I want to keep them connected to the overall strategy and show how their individual goals and projects contribute to the bigger picture.”
Here's a breakdown of why a team strategy dashboard is useful:
What is the team’s role?
Here, we’re focusing on teams tasked with executing the strategy at an operational level. These teams manage various business goals, strategic projects, and key performance indicators (KPIs) vital for moving the organization forward. Not every team member may see their direct role in executing the strategy, and their engagement levels with the overall strategy might vary.
What outcome do you want when they look at your strategy dashboard?
A strategy dashboard is vital for internal teams because it boosts engagement. Instead of team members just going through the motions of their daily tasks, a dashboard keeps them focused on the impact of their work.
For example, in a logistics team, a performance dashboard can visually link how improvements in shipping times or reductions in transportation costs directly contribute to the company's efficiency and customer satisfaction.
This approach motivates team members by highlighting their contribution to key objectives and promotes accountability by clearly attributing outcomes to specific actions.
Additionally, the dashboard facilitates operational efficiency by providing a platform for real-time updates and collaborative problem-solving, which is essential for being proactive and adaptable.
Best practices for creating a strategy dashboard for internal teams
When creating a strategy dashboard for your team, keep these points in mind:
- Focus on outcome-driven metrics: Center the dashboard on the outcomes your team aims to achieve. Avoid getting bogged down in too much tactical detail. For example, if your team is in sales, highlight metrics like monthly sales growth or customer acquisition rates rather than the minutiae of daily sales activities.
- Personalize with names: Include team members' names in the dashboard to foster accountability and empowerment.
- Represent everyone’s work: Ensure each team member's contributions are visible on the dashboard. This approach can be as simple as having a section for each team member's current projects, showing that all roles are valued and crucial.
- Use relevant time frames: Align the dashboard's time frames with your regular team meetings. If you review strategy monthly, focus on performance metrics and progress relevant to the past month rather than yearly data. This keeps the dashboard timely and applicable to your discussions.
👉Here's how you can customize your dashboards in Cascade:
You can choose textual, chart-based, and metric-based widgets to display live information from your strategic plans. To visualize data for a specific date, click on that date or select the start and due dates from the date picker for a range.

These widgets automatically update when you make progress updates across the platform, so you don’t have to worry about outdated information.
3. Strategy Dashboard For The Public
A fascinating trend in strategy is the move towards greater transparency and accountability.
We're getting numerous requests from customers who want to create strategy dashboards for public viewing. This is especially common among non-profits and companies focused on corporate social responsibility.
“We're proud of our work and want to share our success stories with our major stakeholders, one of whom is the public.”
At Cascade, we love helping our customers build these types of dashboards. Here's a breakdown of why a public strategy dashboard is useful:
What is the public’s role?
The public's role often extends beyond just being customers. For charities, the public is directly involved as donors. A public dashboard can be a tool for these organizations to display their achievements and progress, motivating more donations.
For large corporations like Coca-Cola, which focus on sustainability and environmental goals, the public is more like a key partner.
These companies use dashboards to show how well they do in areas like reducing carbon footprint, saving water, and implementing sustainable packaging initiatives.
This level of transparency bolsters stakeholder trust and underscores the company's commitment to environmental stewardship.
What outcome do you want when they look at your strategy dashboard?
Public dashboards are mainly for sharing good news and positive results. They are meant to impress people and show that the organization keeps its promises.
But it's also important to be honest and show the not-so-good parts. This means discussing challenges or areas where things haven't gone as planned. Being open about both the good and the tough stuff, especially in reports about Environmental, Social, and Corporate Governance (ESG), is crucial.
It helps people and other companies see that you're committed to honesty and doing your best, which can significantly influence their trust and regard for you.
Best practices for creating a strategy dashboard for the public
When creating a strategy dashboard for the public, consider this:
- Focus on high-level information: The public is more interested in the overall progress toward your strategic goals rather than the details of your operations.
- Avoid internal jargon: Ensure your public dashboard is free of company-specific or technical terms. It should be easily understandable to anyone who reads it.
- Highlight owners: Don’t hesitate to include the names of people responsible for various projects or KPIs. This adds a personal touch to the dashboard, making it more relatable and engaging for the public.
- Keep the data fresh: Set frequent reminders to refresh the data, as outdated information can lead to misunderstandings about the organization’s performance.
👉 Here’s how you share progress in Cascade:
While you can’t share Cascade’s Dashboards with external stakeholders for security and privacy reasons, you can use Reports as an alternative.
Compared to dashboards as your go-to source for monitoring day-to-day progress, Cascade's Reports help you compile all that info into a particular narrative for the audience.
Here’s an example of a report and how to share it in Cascade:

Suppose you must collaborate and share information with your partners, suppliers, or external stakeholders. In that case, you can either invite them to view a specific report or export your report as a PDF. This helps you keep in the loop of external stakeholders without risking your organization’s compliance and privacy.
4. Strategy Dashboard For The Division
In larger organizations, you may want to showcase your team’s or business unit’s efforts to other teams or business units (BU).
“Our organization has been growing substantially, and there’s never been more cross-functional teams across different geographies. We want to show other teams what we're up to strategically, both to educate them but also to encourage cross-collaboration.”
These dashboards usually center around the main function of your team, division, or BU. For example, you might have a Marketing Dashboard, a Sales Dashboard, or an R&D Dashboard.
What is the role of divisions?
Your audience here is potentially very broad. Senior managers could use your dashboard to gauge how this part of the business performs. Or, other teams might be interested in your team's work.
As such, these dashboards need to strike a balance between high-level information and detail.
What outcome do you want when they look at your strategy dashboard?
When other employees look at your strategy dashboard, what you aim for goes beyond simple data visualization. Here's what you want to achieve:
- The dashboard should help others understand how your unit’s work aligns with and contributes to the company's broader objectives. For example, showcasing success in product innovation can illustrate your team's role in driving organizational growth.
- The dashboard should also be a catalyst for collaboration. It should highlight areas where collaboration with your team could be beneficial. By providing valuable insights into your projects and strategies, the dashboard can spark ideas for joint initiatives or shared resources.
- Your dashboard can serve as a performance benchmark for other units. It’s about setting a standard that others might strive to achieve or exceed, promoting a culture of excellence.
In a nutshell, the ultimate goal of your KPI dashboard is not just about providing information. It's about inspiring and facilitating better cross-collaboration and continuous performance enhancement across the organization.
📚Recommended read: Horizontal Vs Vertical Strategic Alignment
Best practices for creating a strategy dashboard for other divisions
When designing a strategy dashboard to represent your team or division to internal stakeholders, consider the following guidelines:
- Highlight the major projects: Ensure the dashboard includes the significant projects or initiatives your team is currently working on.
- Put the key metrics at the top: Incorporate core business metrics that resonate with individuals outside your team.
Add context: Instead of just presenting raw data sets and KPIs, add insights that explain why certain KPIs are important. For example, here’s how you can explain in Cascade’s Dashboard why you’re focusing on specific KPIs:

You can use a “Notes” Widget to add summary, context, or messages. This widget supports rich text, bullets, and hyperlinks. You can place it anywhere in the dashboard to ensure it effectively supports your narrative.
5. Strategy Dashboard For Your Boss
Creating a strategy dashboard for your boss can be the easiest and—ironically—the most challenging task.
“My boss is a very particular type of person. She loves seeing details and graphs. I want a dashboard that will impress the socks off of her and get me that pay rise I've been dreaming about...!”
Your boss's personality will be a big driver of how you create this dashboard. Are they analytical or theoretical? Data-driven or word-obsessed? This understanding will guide your dashboard design.
Here's a breakdown of why this strategy dashboard is useful:
What is your boss’s role?
Primarily, your boss needs to understand your, your team's, or your division's performance. The dashboard should offer clear insights into progress, achievements, and challenges.
Remember, this dashboard is not only for your interaction with your boss but also a tool for them to report upwards, showcasing the successes and ongoing activities in your team or business unit.
Your dashboard should help your boss communicate these insights, enabling them to have constructive discussions with their superiors.
What outcome do you want when they look at your strategy dashboard?
When your boss views the dashboard, the objective is straightforward: it should succinctly present the key elements of your or your team's performance. You must paint an honest picture, whether celebrating successes or highlighting areas needing improvement. This transparency helps your boss understand the situation and offers support where needed.
The dashboard should also be a foundation for discussing performance and how your team's efforts align with the broader organizational strategy. It should be a tool for informed decision-making, helping your boss in resource allocation, strategy adjustments, and goal-setting.
Finally, the dashboard is a means for continuous improvement. By tracking data over time, you and your boss can identify opportunities for enhancement and refine strategies for better outcomes.
Best practices for creating a strategy dashboard for your boss
When developing a strategy dashboard for your boss, consider these effective strategies:
- Display major goal status updates: Use visual indicators like progress bars or color-coded status updates (e.g., green for on-track, yellow for at-risk, red for off-track) to provide an at-a-glance view of each major goal.
- Provide a concise summary: Include a brief overview of what has been accomplished recently and outline the focus areas for the upcoming month. Use bullet points to keep the information digestible and focused.
- Break down resource allocation: Explain how your time (or your team's) is allocated and how these activities align with and contribute to the overall strategy.
- Highlight roadblocks and risks: Be sure to raise any issues where you need your boss's help to get them on board with solving your problems.
- Use interactive elements: Include interactive elements such as filters or drill-down options for advanced data analytics.
👉How to create interactive dashboards in Cascade:
Cascade offers a variety of pre-built and custom charts that provide a business intelligence tool-like experience and complete flexibility to help you conduct in-depth analysis by slicing and dicing different types of data and provide a visual insight with bar, line, and pie charts.
Here’s how you build custom charts in Cascade:

If you want to expand further or drill down to view details, you can simply click on a bar in the bar chart, a dot in the line chart, or a portion of the pie in the pie chart to open a detailed chart context table:
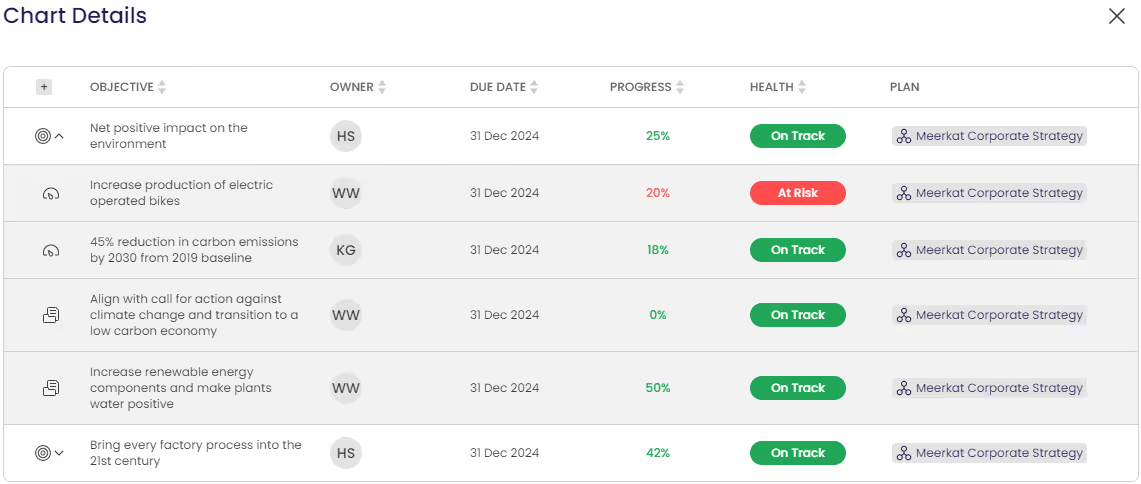
In this table, you can see the details like owner, due date, progress, health of the objective/measure/action, and the relevant plan.
Build Your Strategy Dashboards With Cascade 🚀
Strategy dashboards offer little value if they’re isolated within various project management tools, cumbersome spreadsheets, or detached from day-to-day operational data. This disconnection hinders an organization's ability to make swift, informed business decisions, leading to strategic misalignment, missed targets, and a delayed response to market changes.
Cascade addresses this challenge with a centralized strategy execution platform. With over 1,000 integrations, Cascade consolidates all your data sources into one place, providing immediate strategic insights. You can use dynamic interactive elements like filters and drill-down options to tailor data visualizations and focus on the key metrics most crucial to your organization’s success.
What sets Cascade’s Dashboards and Reports apart from other reporting tools is their ability to connect your operational data with strategic initiatives, providing a clear, data-driven perspective on how well your initiatives align with your strategic goals.
And you can invite anyone in your organization to collaborate, comment, and strategize.
This approach ensures everyone aligns with your overarching business goals, driving better cross-collaboration and speeding up your path to the desired outcomes and growth.
Want to see Cascade in action? Get a live demo today!
FAQ
What are the three types of dashboards?
In the business world, we mainly use three types of dashboards: Operational, Analytical, and Strategic. Operational dashboards keep you in the loop with real-time updates on daily activities, perfect for quick decisions. Analytical dashboards are great for digging into data, helping you spot trends, and making sense of past performance. And for the big picture, strategic dashboards track your key metrics and long-term goals, giving you a bird's-eye view of where your business stands and where it's headed.
.png)
.png)

.png)


